

Introduction
Every engineered surface carries a texture — and that texture quietly determines whether a component lasts, leaks, wears, or fails.
If you arrived here looking for a quick definition of surface roughness, you will find one — but this guide goes considerably further than that.
It is written for engineers, manufacturing professionals, and students who want a working understanding of the topic, not just a vocabulary entry.
The guide builds from how surface texture is structured and measured, through the standards that govern those measurements, to the real functional consequences roughness has in service — and the manufacturing decisions that shape it.
The best place to start is with what surface roughness actually means in an engineering context, and how it fits within the broader picture of surface texture.
TL;DR
Surface roughness is not a cosmetic detail — it is a functional engineering parameter. The texture of a surface is a design decision with measurable consequences for how components wear, seal, carry load, and endure fatigue. Understanding it properly means knowing not just what roughness values mean, but what they miss, and how manufacturing choices produce them.
This article covers:

The surface texture hierarchy: roughness, waviness, and form
Core roughness parameters: Ra, Rz, Rq, and Sa
Why Ra alone can be misleading
Measurement standards: ISO 4287, ISO 25178, ASME B46.1
Roughness effects on wear, friction, sealing, and fatigue
How machining and post-processing shape surface texture
What is roughness meaning in engineering?
Every production process leaves a signature on the surfaces it creates — and that signature carries real engineering consequences. Understanding the precise roughness meaning in an engineering context means moving beyond the everyday sense of the word and into a technically defined framework that governs how surfaces are characterised, specified, and evaluated.
In engineering, surface roughness is not simply a measure of how uneven or harsh a surface feels to the touch. It is a formally defined component of surface texture: the fine-spaced, shorter-wavelength irregularities on a surface that arise directly from the action of the production process — the cutting tool, the abrasive grain, the casting interface, or the material's own microstructure.
The surface texture hierarchy: form, waviness, and roughness
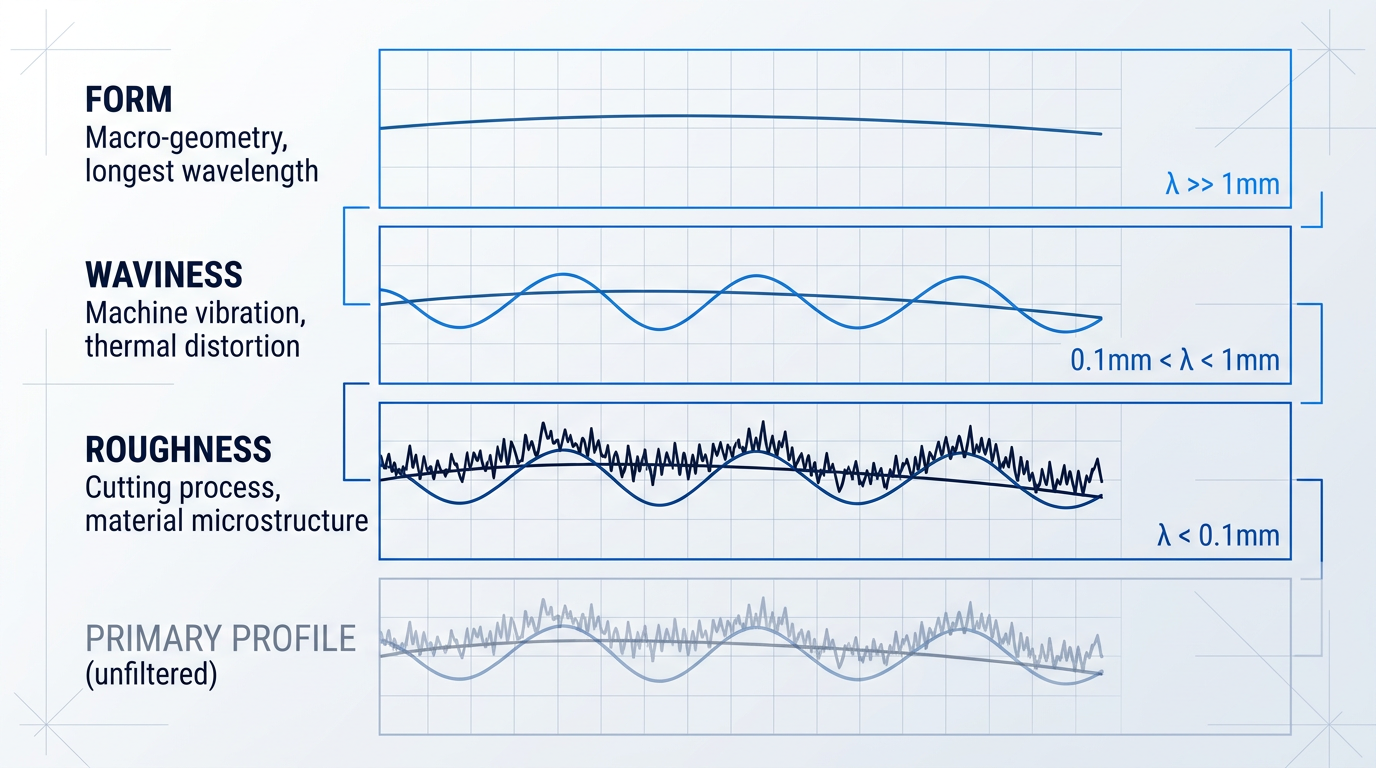
Surface texture is not a single, undifferentiated property. It is composed of at least three distinct components, each occupying a different band in the spatial wavelength spectrum — and understanding this hierarchy is the prerequisite for measuring or specifying any of them correctly.
- Form: The macro-geometry of the surface: flatness, cylindricity, straightness. The longest-wavelength component, typically assessed by coordinate measurement rather than surface texture instruments.
- Waviness: Intermediate-wavelength undulations caused by machine vibration, chatter, thermal distortion, or deflection during machining. Sits between form and roughness in the spatial frequency spectrum.
- Roughness: The fine-spaced, shorter-wavelength irregularities produced directly by the cutting process, grain structure, and material behaviour at the machining interface.
These three components are not visually obvious categories that an engineer can separate by inspection — they are formally distinguished by filtering the measured surface profile. A surface that reads as rough under one measurement approach may in fact carry high waviness but relatively low roughness, and conflating the two leads directly to wrong engineering decisions: specifying the wrong parameter, applying the wrong filter setting, or drawing incorrect conclusions about a surface's fitness for purpose.
How filtering separates roughness from waviness
When a surface is measured, the raw output is the primary profile — a trace that contains all three components simultaneously: form, waviness, and roughness superimposed on one another.
Filtering separates these components mathematically. A high-pass filter removes the longer-wavelength content (waviness and form) to isolate the roughness profile; a low-pass filter removes the shorter-wavelength content (roughness) to yield the waviness profile. The critical parameter governing this separation is the cutoff wavelength λc — the boundary frequency that defines where roughness ends and waviness begins. Because the choice of λc directly determines which surface features end up in the roughness measurement, it is not an incidental instrument setting; it is a fundamental part of the measurement specification itself.
Lay: the direction of the surface pattern
Surface texture has a fourth attribute beyond the three wavelength components: lay. Lay is the predominant direction of the surface pattern — the orientation of the surface features as determined by the production method. A turned surface has a circumferential lay; a ground surface has a lay aligned with the grinding direction; a spark-eroded (EDM) surface has a non-directional, isotropic lay with no preferred orientation.
Lay matters because surface behaviour is often direction-dependent: friction, lubrication film formation, and sealing performance can all differ significantly depending on whether a mating surface moves with or across the lay.
Surface roughness as a functional engineering parameter
The most important shift in perspective this guide asks of the reader is this: surface roughness is not a cosmetic by-product of manufacturing. It is a functional engineering parameter with measurable consequences for how components perform in service.
Roughness governs friction at sliding interfaces, the rate of wear, the formation and retention of lubrication films, sealing integrity under pressure, the adhesion strength of coatings and bonded joints, and the initiation of fatigue cracks at stress-concentrating surface features. A surface that appears smooth to the naked eye may be entirely inadequate for a precision sealing application; a surface that looks rough may be well-suited to a bonded joint where adhesion depends on mechanical keying.
Surface roughness specification is a deliberate engineering decision with measurable functional consequences — not a tolerance applied after the fact to describe what the machine happened to produce.
To engage meaningfully with surface roughness, the reader also needs a sense of the physical scale involved. Roughness is characterised in micrometres (µm) — one micrometre is one millionth of a metre, or one thousandth of a millimetre. For reference, a human hair is approximately 70 µm in diameter; typical engineering surfaces span from sub-micrometre values for precision-ground or lapped components to tens of micrometres for rough-machined or as-cast surfaces.
With the surface texture hierarchy, the role of filtering, lay, and the functional significance of roughness now established, the natural next question is how roughness is actually measured and expressed in practice — which is where the formal parameters come in.
Ra, Rz, Rq, and Sa: The Core Roughness Parameters
A roughness value is only meaningful when both parties — the designer specifying a surface and the engineer inspecting it — are working from the same definition. The choice of parameter shapes what a surface specification actually communicates, and using the wrong one for a given application can mean a surface passes inspection while still failing in service.
Four parameters form the core vocabulary of surface roughness measurement: Ra, Rz, Rq, and Sa. Each captures a different aspect of surface height variation, and each has contexts where it is the most informative choice.
Ra — Arithmetic Mean Roughness
Ra is the most widely used surface roughness parameter in engineering and manufacturing quality control worldwide.
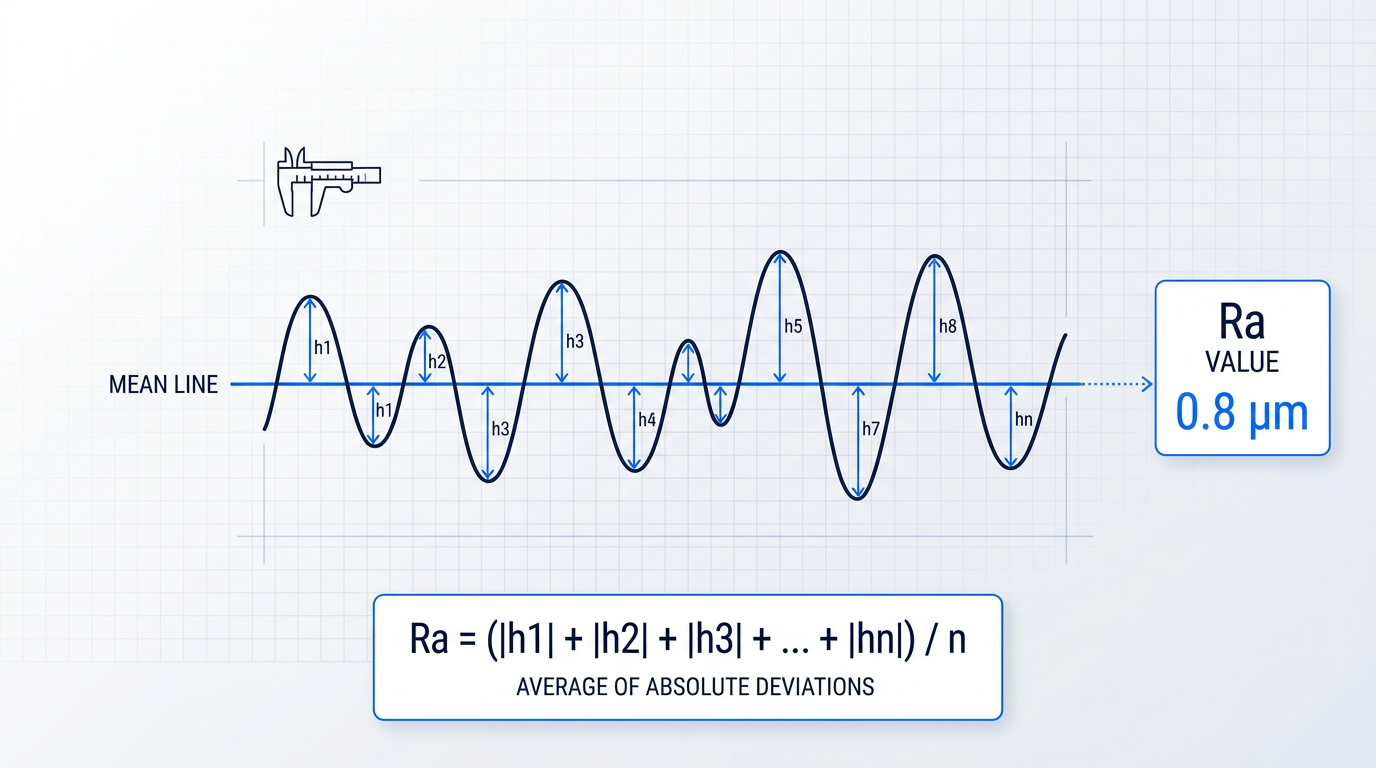
Conceptually, Ra is the arithmetic mean of the absolute height deviations from the mean line, measured over the evaluation length. Take every point along the roughness profile, measure how far it sits above or below the mean line (ignoring whether it is above or below), and average all those distances: that average is Ra.
Because it averages across the entire profile, Ra is a smoothing operation — isolated peaks and valleys contribute to the result, but they are diluted by the many data points around them. The outcome is a single representative number for the overall height amplitude of the surface: higher Ra means rougher on average, lower Ra means smoother.
Its universality is its primary strength. Ra is simple to measure, widely understood across industries, routinely specified on engineering drawings globally, and supported by all major standards including ISO 21920 and ASME B46.1.
All roughness parameters are expressed in micrometres (µm). To anchor the physical scale: precision-ground or superfinished surfaces can reach Ra values well below 1 µm, while rough-machined or as-cast surfaces may measure in the tens of µm. The range spans several orders of magnitude, which is part of why a shared parameter vocabulary matters so much.
Rz — Mean Roughness Depth
Where Ra averages deviations across all profile points, Rz focuses specifically on the extremes.
Rz is defined as the mean of the peak-to-valley heights measured across consecutive sampling lengths within the evaluation length. For each sampling length, the vertical distance between the highest peak and the deepest valley is recorded; Rz is the average of those individual peak-to-valley heights.
This makes Rz considerably more sensitive than Ra to surface damage, scratches, tool marks, and isolated defects — features that create large local excursions between peaks and valleys which Rz captures directly, but which Ra tends to smooth away.
An important practical note: the definition of Rz differs between ISO and ASME standards. Under ISO 21920 (and its predecessor ISO 4287), Rz is the mean peak-to-valley height across sampling lengths as described above. In older usage and some alternative frameworks, Rz has been used to denote what is now more precisely called Rt — the maximum peak-to-valley height over the entire evaluation length. When reporting or interpreting Rz values, citing the governing standard is essential; the same number can mean different things depending on the framework applied.
For surfaces where individual defects matter — sealing faces being a classic example — Rz is frequently specified alongside Ra on engineering drawings precisely because it catches what Ra's averaging can obscure.
Rq — Root Mean Square Roughness
Rq is the root mean square (RMS) roughness — the RMS equivalent of Ra.
To calculate Rq, each height deviation from the mean line is squared, the mean of those squared values is taken, and the square root of that mean is returned. The squaring step is the key distinction: it gives greater statistical weight to larger deviations, so a surface with a few tall peaks or deep valleys will produce a noticeably higher Rq than Ra, even when the overall profile looks similar.
Rq sits between Ra and Rz in terms of sensitivity to extremes: more sensitive than Ra (which dilutes outliers through simple averaging), but less directly focused on peak-to-valley heights than Rz.
The RMS formulation also connects Rq directly to the standard deviation of the surface height distribution — assuming a profile with a zero mean, Rq and the standard deviation of heights are mathematically equivalent. This makes Rq particularly valuable in tribological modelling and optical surface characterisation, where the statistical distribution of surface heights drives contact mechanics and light scattering behaviour respectively.
Rq is also denoted Sq in the areal parameter family governed by ISO 25178, which brings us to the fourth parameter.
Sa — Areal Arithmetic Mean Height
Sa is the three-dimensional extension of Ra: rather than measuring height deviations along a single profile line, Sa measures the mean absolute height deviation across an entire surface area.
Sa is governed by ISO 25178, the international standard for areal (3D) surface texture measurement.
The conceptual shift from Ra to Sa is significant. A single stylus trace is one narrow slice through the surface, and texture is rarely perfectly uniform across a part — directional patterns, isolated defects, and localised texture variations can all be missed by a single profile measurement. Sa integrates height information across the whole measurement area, giving a more statistically representative picture of the surface as it actually exists in three dimensions.
Sa is one parameter within the broader ISO 25178 areal family, which includes 3D counterparts to Rz, Rq, and other profile parameters. The full scope of that parameter set is developed later in this guide; for now, Sa serves as the clearest illustration of why areal measurement offers a more complete characterisation than any single profile trace can provide.
What All Four Parameters Share
Ra, Rz, Rq, and Sa are all amplitude parameters — they describe the vertical dimension of surface texture, quantifying how far peaks and valleys deviate from the mean surface.
Ra, Rz, Rq, and Sa all measure height. None of them say anything about the horizontal dimension of surface texture: the spacing between features, their frequency, or the sharpness of peaks and depth of valleys. Two surfaces can share an identical Ra value while behaving very differently in service.
This shared characteristic is not a flaw in any individual parameter — it is simply the boundary of what amplitude measurements can tell you.
Understanding that boundary is what makes the next question so important: if all four parameters are measuring the same dimension of the surface, what are we missing — and does it matter for engineering performance? That is precisely what the following section examines.
Why Ra Alone Is Not Enough
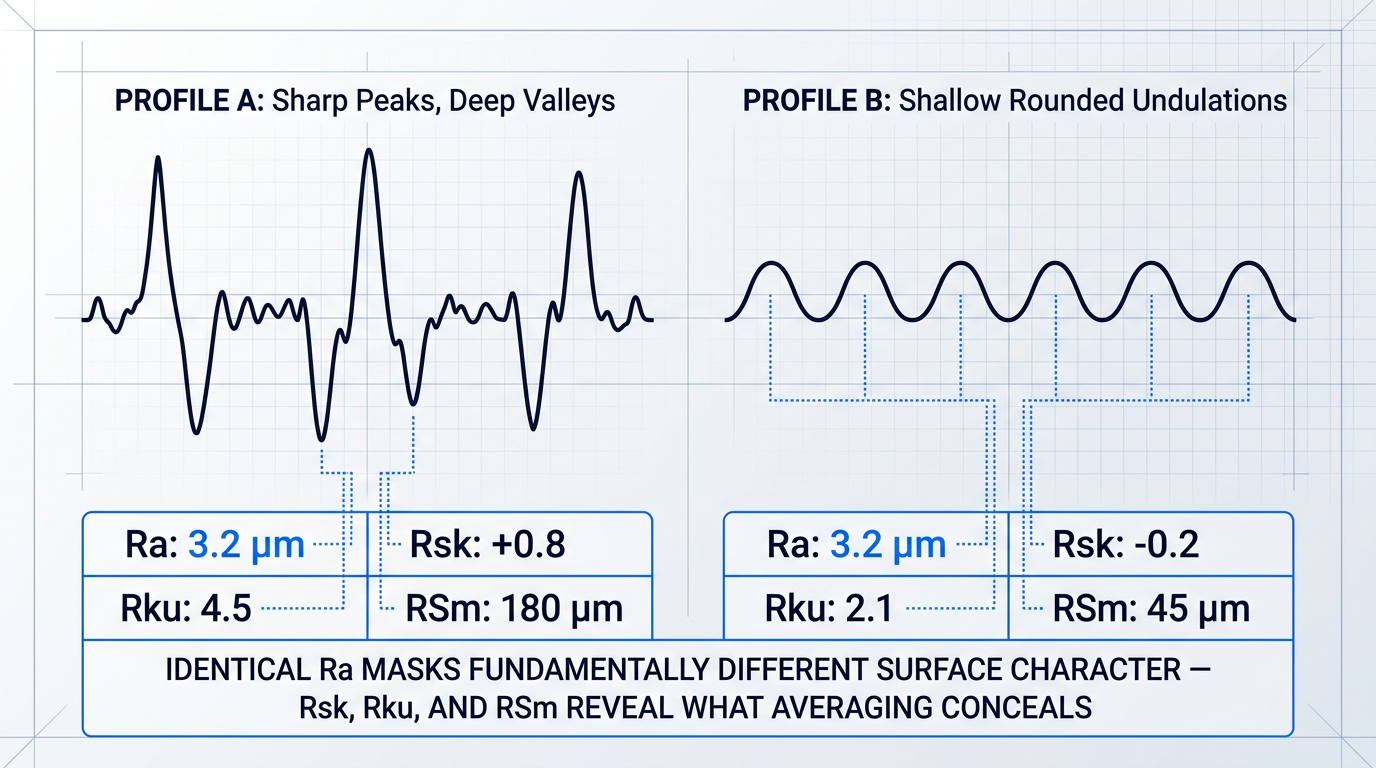
Take two machined surfaces with identical Ra values. One has a few sharp, tall peaks separated by deep valleys; the other carries many shallow, rounded undulations distributed evenly across its length. By Ra's measure, they are the same surface — yet one concentrates stress at each asperity contact while the other distributes it broadly. They will wear differently, lubricate differently, and seal differently. Ra cannot tell them apart.
The reason lies in Ra's fundamental mechanism: it averages the absolute height deviations from the mean line across the evaluation length, a calculation that is deliberately insensitive to individual features.
That insensitivity is not a flaw in isolation — it is precisely what makes Ra stable, reproducible, and broadly applicable for general surface finish control. But for functional surfaces where the shape, sharpness, and spacing of features govern real performance, averaging absolute deviations masks exactly the information that matters most.
The Mitutoyo Surface Roughness guide notes directly that "the arithmetical mean roughness value Ra is hardly affected by individual peaks" — a concise statement of the limitation that every engineer specifying a functional surface should keep in mind.
The Parameters That Fill the Gaps
Three parameters address the dimensions of surface character that Ra cannot resolve: Rsk (skewness), Rku (kurtosis), and RSm (mean peak spacing). Each adds a genuinely different kind of information.
- Rsk — Amplitude distribution asymmetry: Describes whether the profile is valley-dominated (negative Rsk) or peak-dominated (positive Rsk). The functional significance depends strongly on operating conditions.
- Rku — Peak sharpness: Describes the peakedness of the amplitude distribution. High Rku indicates sharp, infrequent peaks; low Rku indicates broad, rounded features. Directly affects stress concentration and wear initiation.
- RSm — Mean peak spacing: Describes the average distance between successive profile peaks. A purely spatial parameter — tells you how frequently features occur, not how tall they are.
Rsk, or skewness, describes the asymmetry of the amplitude distribution of the surface profile. A negative Rsk indicates a valley-dominated surface: the profile has more material near the mean line, with deeper valleys sitting below it.
In lubricated contacts, those valleys act as lubricant reservoirs while the plateau regions carry load — a configuration that research consistently links to reduced friction under mixed and boundary lubrication conditions. The Purdue ME556 reference states that "a negatively skewed surface is good for lubrication purposes," and rolling bearing fatigue studies corroborate that decreasing skewness improves fatigue life under lubricated conditions.
The picture is more nuanced in dry contact. Research published in Tribology International found that positive skewness predicts lower static friction coefficient values than the Gaussian case under dry conditions, while negative skewness predicts higher values — the reverse of the lubricated trend.
This context-dependence is precisely what makes Rsk valuable: it captures a dimension of surface character that Ra cannot see at all, and its functional significance shifts with the operating regime. Specifying Ra alone gives no visibility into that dimension, regardless of which way it cuts.
Rku, or kurtosis, adds a further dimension that even Rsk cannot resolve. It describes the sharpness of the amplitude distribution — how peaked or flat it is.
A high Rku value indicates a surface with sharp, infrequent peaks and valleys; a low Rku indicates broad, rounded features. Two surfaces with identical Ra and identical Rsk can still differ in Rku, and that difference has direct consequences for stress concentration, wear initiation, and contact mechanics.
For fatigue-critical components, the Springer surface roughness study notes that both Ra and kurtosis should be considered together, because material distribution at profile height governs stress concentration — not just the average height value.
Skewness and kurtosis are independent parameters. Two surfaces can share the same Ra, the same Rsk, and still diverge in Rku — meaning their asperity sharpness, contact mechanics, and wear behaviour differ in ways no amplitude average can detect.
RSm, or mean peak spacing, introduces something neither Rsk nor Rku can provide: a spatial dimension. Ra describes how tall surface features are; RSm describes how far apart they are.
Two surfaces with identical Ra can have very different RSm values — one with tightly packed fine features, one with widely spaced coarser ones. As the Keyence spatial parameters resource explains, surfaces with small RSm values have closely packed features that may improve sealing and lubrication performance, while larger spacing is associated with reduced friction and lower wear rates.
That spacing governs whether a lubricant film can fully establish itself between asperity contacts — a consideration that amplitude parameters are structurally incapable of capturing.
It is also worth recontextualising Rz here. Because Rz captures average peak-to-valley heights rather than averaging all deviations, it is significantly more sensitive to isolated scratches, tool marks, and localised surface damage than Ra.
For surfaces where individual defects are the governing concern — sealing surfaces and fatigue-critical components, for instance — Rz is a more appropriate indicator than Ra precisely because it is not smoothed by averaging. The Mitutoyo guide recommends Rz specifically for surfaces "in which individual deviations have a significant influence on the function of the surface."
The engineering principle that follows from all of this is straightforward: specifying only Ra on a drawing is an oversimplification for any surface with a defined functional role.
Appropriate surface characterisation means selecting parameters that reflect what the surface needs to do in service — amplitude parameters for general height characterisation, skewness and kurtosis for distribution shape, spacing parameters for feature frequency. The choice should be deliberate and driven by function, not habit.
Selecting the right parameters only creates value, of course, when those parameters are measured and reported under a consistent, agreed framework. That is precisely what international measurement standards govern — and it is where the next section picks up.
Surface Roughness Measurement Standards: ISO 4287 and Beyond
An Ra value written on an engineering drawing is only meaningful if everyone reading it measures it the same way. Change the cutoff wavelength, the evaluation length, or the filter type, and the same physical surface will return a different number — sometimes dramatically so. Without a shared measurement framework, a surface finish specification is not a specification at all; it is an assumption that the manufacturer and the quality inspector happen to be using compatible conditions. Measurement standards exist to make that assumption unnecessary.
The standards framework is not static bureaucracy — it is living engineering infrastructure that tracks the evolution of measurement technology and industrial practice.
ISO 21920: The Current Profile Method Standard
For decades, ISO 4287 was the foundational standard for 2D profile-based surface texture measurement, defining parameters including Ra, Rz, Rq, Rsk, Rku, and RSm alongside the filtering methodology and measurement conditions that made those parameters comparable across instruments.
In December 2021, ISO 21920 was published as a three-part series, replacing ISO 4287, ISO 4288, ISO 13565, and ISO 1302 in their entirety — standards that, as Mahr's Head of Surface Metrology Development noted, "no longer covered all the possibilities of modern measuring instruments" and "in some cases had fuzziness in the definition of some parameter algorithms."
The new standard modernises parameter definitions, introduces updated terminology (including the evaluation length le and the nesting index as a replacement for the cutoff wavelength designation), and explicitly accommodates optical measurement instruments alongside contact profilometry — a significant update reflecting how industrial metrology has evolved.
One practical consequence for drawing specifications: ISO 21920 applies only to new drawings, while older dated drawings retain their validity under the previous standard — so a manufacturer may need to support both frameworks simultaneously during the transition period.
ISO 25178: The Areal (3D) Surface Texture Standard
ISO 25178 governs areal surface texture measurement — characterising a surface across a defined area rather than along a single profile trace — and defines the Sa, Sz, Ssk, Sku, and the broader family of areal parameters introduced in the earlier sections of this guide.
As optical instruments such as white-light interferometry systems, confocal microscopes, and focus-variation profilometers become mainstream in industrial metrology, ISO 25178 becomes the operative standard: these instruments generate three-dimensional areal datasets, and it is ISO 25178 that defines how those datasets are filtered, evaluated, and reported to make results comparable and traceable.
This connects directly to the multi-parameter argument established earlier in this guide — areal parameters provide a more complete characterisation of surface texture than a single profile trace, and ISO 25178 is the standards framework that gives those measurements their meaning across different laboratories and instruments.
ASME B46.1 and the Principal Standards Compared
In the United States, surface texture measurement and reporting is governed by ASME B46.1, which defines roughness, waviness, and lay parameters for surfaces produced by processes including cutting, casting, coating, and plastic deformation.
The three principal standards cover distinct but overlapping territory — the table below maps each against the measurement approach it governs, the parameter family it defines, and the key practical scope difference.
| Standard | Published / Current | Measurement Approach | Key Parameter Family | Notable Scope Point |
|---|---|---|---|---|
| ISO 21920 | 2021 (replaces ISO 4287, 4288, 13565, 1302) | 2D profile — contact and optical | Ra, Rz, Rq, Rsk, Rku, RSm | Accommodates optical instruments; applies to new drawings only |
| ISO 25178 | Ongoing multi-part series (e.g. ISO 25178-2) | 3D areal — optical and contact | Sa, Sz, Ssk, Sku, and full areal parameter set | Governs all areal topography measurements from optical instruments |
| ASME B46.1 | Current edition: B46.1-2019 | 2D profile — contact stylus primary | Ra, Rz, Wt, and related profile parameters | Rz defined differently from ISO — not mathematically identical |
Comparison of the three principal surface roughness measurement standards across governing scope, parameter family, measurement method, and a key practical distinction.
The most operationally significant difference in this comparison is the Rz definition mismatch between ISO and ASME B46.1: under ISO 21920, Rz is the mean height of profile elements calculated across sampling lengths, while ASME B46.1 defines Rz as the average difference between the five highest peaks and five deepest valleys over the evaluation length — two approaches that yield different numerical results from the same surface.
Because the two definitions are not mathematically identical, an Rz value reported without citing the governing standard is ambiguous. In cross-border supply chains where components move between ISO and ASME contexts, this difference is a documented source of acceptance disputes — not a theoretical concern.
For UK and European engineers working with US customers or suppliers, this is not a minor technicality: it means that quoting an Rz value without specifying whether it was measured under ISO 21920 or ASME B46.1 leaves room for genuine disagreement about whether a part meets its specification.
BS EN ISO Standards: The UK Adoption Framework
In UK engineering contexts, quality systems, supplier contracts, and drawing specifications often reference BS EN ISO standards — for example, BS EN ISO 25178 — rather than the bare ISO designation.
The BS EN ISO prefix signals that the British Standards Institution has formally adopted the international standard into the UK and European standards system; the normative technical content — every requirement, parameter definition, and measurement condition — is identical to the ISO counterpart, so compliance with BS EN ISO 25178 is compliance with ISO 25178.
These are national adoptions of the international framework, not divergent standards: the prefix carries administrative and contractual significance for UK quality systems, but the underlying engineering content is unchanged.
Cutoff Wavelength: Why Measurement Conditions Must Be Reported
Within the standards framework, one of the most practically consequential choices is the cutoff wavelength (λc) — the filter setting that separates roughness from waviness in the measured profile.
The Taylor Hobson training material illustrates the effect clearly: a hypothetical profile with a roughness wavelength of 0.25 mm and a true Ra of around 20 µm would return a calculated Ra of virtually zero if measured with a λc of 0.08 mm, approximately 10 µm at λc = 0.25 mm, and the correct 20 µm result at λc = 0.8 mm or 2.5 mm — with Ra increasing further still if λc is extended to 8 mm or beyond, as waviness content enters the calculation.
Standards provide guidance tables matching appropriate λc values to expected Ra ranges and surface types — the five standard cutoff lengths (0.08, 0.25, 0.8, 2.5, and 8 mm) are not arbitrary choices but structured defaults tied to the roughness regime being measured.
This is why a bare Ra figure reported without its measurement conditions is incomplete information: two laboratories measuring the same surface with different cutoff selections will report different Ra values, and neither is wrong — they are simply answering different questions about the same profile.
The practical implication for drawing specifications follows directly: when a surface finish is specified on an engineering drawing, the governing standard should be explicitly cited alongside the parameter value and, where it matters, the measurement conditions.
Ambiguity in the standard reference — or the absence of any standard reference — is a real source of quality disputes between designers, manufacturers, and customers; the standard citation is not a formality, it is the mechanism by which the specification becomes unambiguous and enforceable.
With the measurement framework now established — what the parameters are, why multi-parameter characterisation matters, and the standards that make measurements consistent and traceable — the natural next question is what those measured values actually mean for how a component behaves in service.
How Surface Roughness Affects Engineering Performance
Parameters, standards, and measurement filters are only meaningful if surface roughness actually does something — and it does, in ways that are measurable, predictable, and consequential for component life in service.
Across the most demanding application domains in mechanical engineering — tribological contacts, lubricated interfaces, sealing faces, fatigue-critical structures, and bonded or coated assemblies — surface texture is a live engineering variable, not a cosmetic one.
Wear and contact mechanics
When two surfaces are pressed together, contact does not occur across the entire nominal contact area — it occurs only at the tips of opposing asperities, making the real area of contact a small fraction of the apparent area.
Because the applied load is distributed across this much smaller real contact area, the pressure at each asperity junction is far higher than the nominal contact pressure would suggest, concentrating stress at exactly the points most vulnerable to damage.
Rougher surfaces present fewer, sharper asperity contacts, driving up local stress and accelerating both adhesive wear — where cold-welded junctions shear and transfer material between surfaces — and abrasive wear, where harder asperities cut and plough through the softer counterface.
Smoother surfaces spread load across a larger real contact area, reducing stress concentration at individual asperities and generally extending wear life; this is the tribological basis for finishing operations on bearing and sliding surfaces.
Friction, lubrication, and the lambda ratio
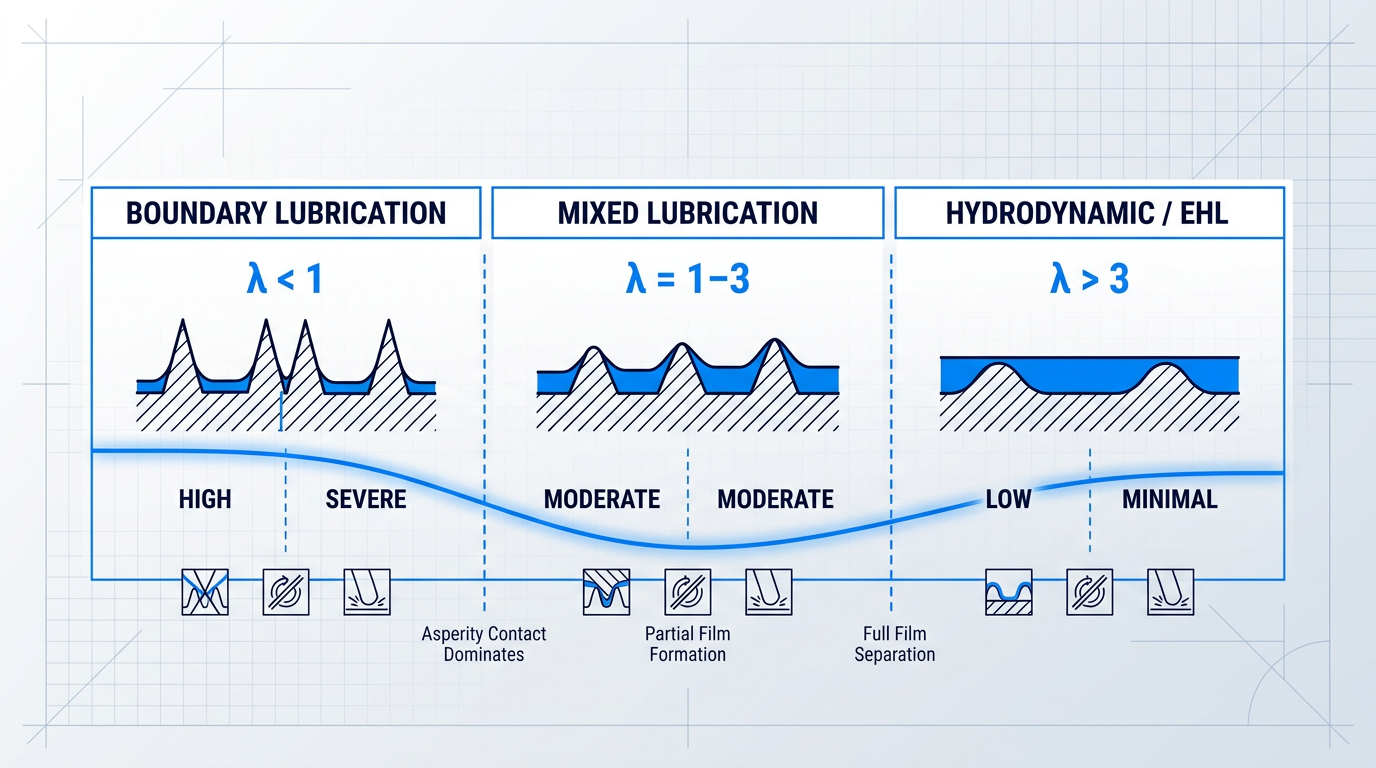
The relationship between surface roughness and friction is most precisely expressed through the lambda ratio (λ) — defined as the minimum lubricant film thickness divided by the composite roughness of the two mating surfaces, where composite roughness is the root-sum-square of their individual Rq values.
The lambda ratio determines which lubrication regime a contact operates in: when λ exceeds approximately 3, a full film separates the surfaces (hydrodynamic or elastohydrodynamic lubrication); when λ falls between 1 and 3, partial asperity contact occurs (mixed lubrication); and when λ drops below 1, direct asperity contact dominates (boundary lubrication), with the highest friction and wear rates.
A surface that is too rough prevents full film formation by allowing asperity peaks to penetrate the lubricant layer, pushing the contact into mixed or boundary lubrication regardless of lubricant supply.
But the opposite failure mode is equally real: a surface that is too smooth can impair lubricant retention, because the valleys in a surface texture act as lubricant reservoirs that sustain the film under load — an overly smooth surface may not hold enough lubricant to prevent starvation during high-load or low-speed operation.
The lambda ratio (λ) — minimum film thickness divided by composite surface roughness — is the single most useful indicator of which lubrication regime a contact operates in. Specifying surface roughness for a lubricated surface without knowing the operating λ is specifying blind.
The optimal roughness for a lubricated surface therefore depends on the lubricant viscosity, operating speed, applied load, and the specific lubrication regime the designer is targeting — there is no universal optimum, only an application-specific one.
Sealing surfaces
Sealing performance depends on controlling surface roughness within a narrow band in both directions: surfaces that are too rough create leak paths along peaks and valleys through which pressurised fluid can escape, while surfaces that are too smooth prevent the seal material from conforming correctly and deprive the interface of the lubricant retention needed to reduce seal wear.
This is a concrete instance of the multi-parameter characterisation principle covered earlier — Ra alone is insufficient for sealing surface specification because it averages over the profile and cannot distinguish between a surface with extreme isolated peaks and one with a uniform, load-bearing plateau texture.
Rz captures the peak-to-valley extremes that govern leak-path formation, while Rmr (the material ratio, also known as the bearing area ratio) describes how much of the surface is load-bearing at a given depth — a high Rmr value indicates a plateau-like profile that supports the seal without sharp peaks that would accelerate wear.
Industry sealing guidance, including Parker's published surface finish specifications for hydraulic and pneumatic applications, specifies Ra, Rz, Rp, and Rmr together precisely because the combination identifies whether a surface is too rough, too smooth, or correctly profiled for the application — no single parameter can do that alone.
Fatigue and crack initiation
Under cyclic loading, surface features act as stress concentrators — the peaks and valleys of a rough surface function as microscopic notches, and it is at these notch roots that crack initiation preferentially occurs.
The sharper and deeper the surface features, the more severe the local stress concentration and the earlier fatigue cracks nucleate; research indicates that surface roughness can reduce fatigue life by up to an order of magnitude compared to a well-finished surface, with rougher profiles behaving analogously to sharp micro-notches.
Rz and Rt are more relevant than Ra for fatigue assessment because they capture the worst-case surface features — the deepest valleys and highest peaks — that govern crack initiation; Ra's averaging behaviour smooths over exactly the extreme features that matter most for fatigue life.
Research confirms that the correlation between peak-to-valley roughness and fatigue life is more consistent than the equivalent correlation with Ra — particularly for rolling contact fatigue, where the deepest valleys drive crack nucleation under micro-elastohydrodynamic conditions.
Residual stress and microstructure play significant roles alongside roughness, particularly at intermediate roughness values where residual stress can become a stronger predictor of fatigue performance than surface topography alone — an honest account of fatigue life must hold all three variables in view.
Adhesion and coating performance
Surface roughness governs coating and adhesive bond strength through two competing mechanisms: mechanical interlocking, where the adhesive or coating penetrates surface valleys and anchors against the profile, and stress concentration at the bond interface, where excessively sharp or deep features introduce local stress risers that weaken the joint under load.
The result is a roughness optimum for bond strength — research on adhesive joints consistently shows that shear strength rises with increasing roughness up to a point, then falls as excessive roughness traps air in cavities, reduces effective contact area, and introduces interfacial stress concentrations that promote adhesive failure.
Surface preparation before coating or bonding — whether grit blasting, chemical etching, or laser surface texturing — directly determines the texture the adhesive or coating encounters, making surface roughness specification part of the process chain rather than a finished-part requirement applied after the fact.
The practical implication is that the roughness target for a bonding substrate must be defined in relation to the specific adhesive system, its viscosity, and the joint geometry — the same surface that maximises bond strength for one adhesive may be suboptimal for another.
A bearing surface, a dynamic sealing face, a fatigue-critical aerofoil root, and a bonding substrate all demand fundamentally different surface textures — and specifying the wrong one carries direct engineering consequences, from accelerated wear to premature fatigue failure to seal leakage to bond delamination.
Understanding what surface roughness does in service is only half the challenge; the other half is measuring it reliably on the real components you work with — which is where the practical demands of measurement methodology become consequential.
Measuring Roughness on Complex Geometries
Metrology textbooks tend to illustrate surface roughness measurement on flat, clean, accessible specimens — but the components where roughness matters most are rarely any of those things. Turbine blades, bore interiors, mould cavities, and bearing races all demand measurement, yet none of them cooperate with the simplest instrument setup.
Contact Profilometry: The Reference Standard
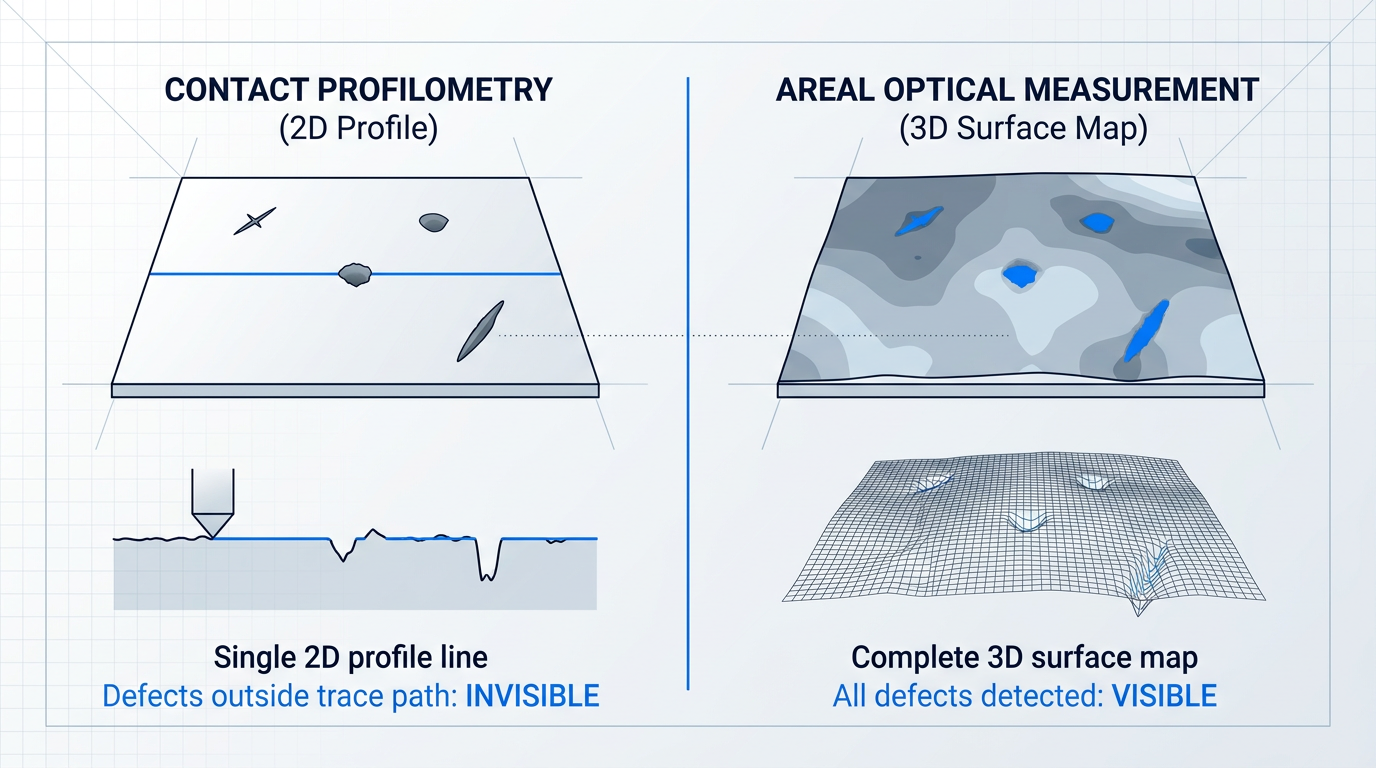
Contact (stylus) profilometry works by dragging a diamond-tipped stylus across the surface in a straight line, recording height deviations along that single path to produce a 2D profile.
It is the dominant method in quality laboratories today, underpinning ISO 4287/21920 and ASME B46.1, and serving as the reference method in most formal quality systems — traceable, repeatable, and well understood under standardised conditions.
Its longevity is earned: for flat, accessible surfaces in a controlled lab environment, stylus profilometry delivers consistent, comparable results that have decades of industry validation behind them.
The Coverage Problem with 2D Profile Measurement
The fundamental limitation is geometric: a single stylus trace is one narrow slice across the surface, and anything that falls outside that path — an isolated scratch, a localised pit, a directional defect — is entirely invisible to the instrument.
This matters acutely on machined surfaces, where roughness is not uniform in all directions. A milled surface with directional tool marks will return very different Ra values depending on whether the stylus traverses parallel or perpendicular to the lay — a point discussed in the surface texture fundamentals covered earlier in this guide.
The practical consequence is that a single profile measurement, however precise, characterises only the line it measured — not the surface as a functional whole.
Physical Limits of Stylus Profilometry
Beyond coverage, the stylus has physical constraints. The finite stylus tip radius sets a hard floor on feature resolution: the tip cannot reach the bottom of grooves or valleys narrower than its own radius, meaning fine surface detail in tight features is systematically under-reported.
Contact also carries a risk on delicate surfaces — thin coatings, soft metals, and precision optical surfaces can be altered by the stylus force, compromising both the surface and the measurement.
On complex 3D geometries, the instrument itself becomes the obstacle: the stylus body, its holder, and the datum skid can be physically blocked from reaching bore interiors, recessed mould cavities, or tightly curved profiles where the geometry prevents correct stylus orientation.
Areal Optical Measurement: Full-Surface Coverage
Areal (3D) optical measurement methods — including white-light interferometry, confocal microscopy, focus variation, and structured light scanning — capture height data across an entire surface area simultaneously, producing a complete 3D surface map rather than a single profile line.
These methods are the natural instrument class for the areal parameters introduced earlier: Sa, Sz, Ssk, and Sku, all governed by ISO 25178, exist precisely because a single profile trace cannot capture the spatial character of a surface.
The practical advantages are significant: isolated defects cannot hide between profile traces, there is no physical contact to alter the surface, and directional patterns or scattered pitting that a stylus would miss become immediately visible in the surface map.
Limitations of Optical Measurement Methods
Optical methods are not universally superior — they carry their own failure modes, and understanding them is as important as knowing their advantages.
- Highly reflective surfaces: Polished metals and mirror-finished moulds can saturate or scatter the optical signal, degrading measurement quality or producing dropout.
- Transparent materials: Glass and some plastics allow light to penetrate rather than reflect from the surface, confusing the instrument about where the surface actually is.
- Steep surface slopes: Slopes exceeding the instrument's numerical aperture cause signal dropout; interferometers are particularly sensitive to angles beyond their acceptance range.
- Highly absorptive surfaces: Very dark or matte materials return insufficient reflected signal, leaving the instrument without enough data to reconstruct the surface reliably.
Each of these failure modes is material- and geometry-specific, which is precisely why method selection cannot be reduced to a blanket preference for one instrument class over another.
Complex Geometries in Practice
The geometries where roughness consequences are most significant — turbine blade profiles, bearing races, engine cylinder bores, hydraulic bores, and freeform mould cavities — are also the geometries that challenge both measurement methods most severely.
For stylus profilometry, the difficulties compound: access restrictions, skid interference on curved profiles, stylus orientation errors on non-planar surfaces, and curvature-induced form removal errors can all degrade or invalidate the result.
Areal optical methods generally offer a more complete picture on these geometries, but steep sidewalls — common in mould cavities and blade profiles — remain a genuine challenge for interferometric techniques where slope-induced dropout can leave critical areas unmeasured.
The honest conclusion is that neither method is universally the right choice: the selection depends on what the geometry allows, what the material permits, and what the specification actually requires.
ISO 4287/21920, ISO 25178, and ASME B46.1 define what to measure and under what conditions. None of them prescribe which instrument to use. Choosing the wrong method for a given geometry can produce results that look valid but are not representative of the surface's functional condition — that judgement belongs to the engineer or metrologist.
One practical point that applies to both methods: the surface must be in the correct condition before measurement begins. Oil films, machining residue, and cleaning residue all affect results, with optical methods particularly sensitive to surface films that alter local reflectance.
With the measurement challenge understood, the next question is how the machining and post-processing decisions that create the surface in the first place can be controlled to meet the specification from the outset.
Controlling Surface Roughness: Machining and Post-Processing
Knowing what surface roughness means and how to measure it only gets an engineer halfway — the harder question is how to produce the surface the functional requirement demands, at a cost the production budget can absorb.
Machining Parameters That Govern Surface Texture
Of all the variables a machinist controls, feed rate has the strongest and most direct influence on surface roughness in turning and milling operations: reduce it and the surface gets finer; push it up to increase throughput and the surface gets coarser.
The underlying physics are captured by the kinematic roughness relationship, expressed as Rz ≈ f²/8rn, where f is feed rate and rn is the tool nose radius.
This formula is best understood as a theoretical floor, not a prediction: real-world machining introduces vibration, machine dynamics, material spring-back, and tool wear, all of which push actual roughness above that minimum.
What the relationship makes unmistakably clear is why feed rate dominates — it appears as a squared term, so doubling feed rate quadruples the theoretical Rz, while doubling the tool nose radius only halves it.
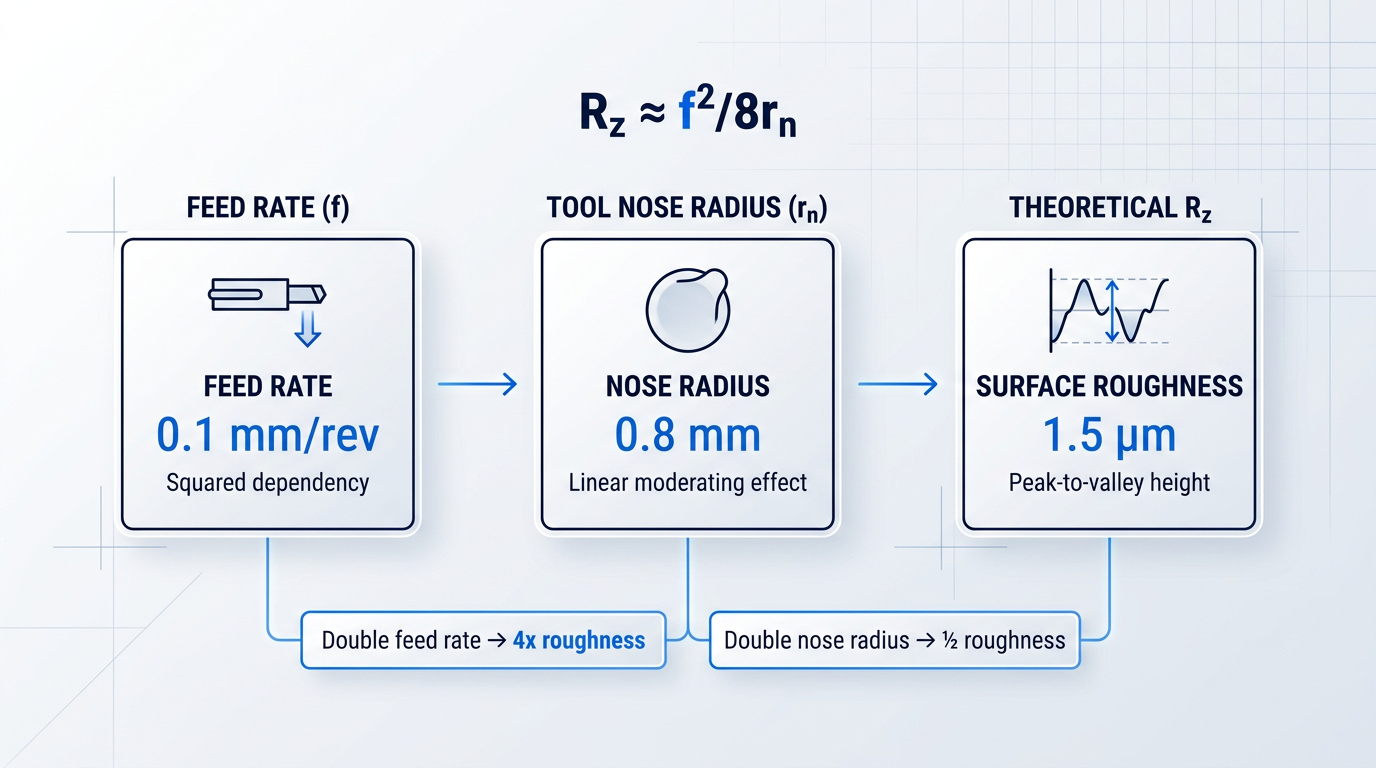
Tool nose radius is an underappreciated lever: for a given feed rate, selecting an insert with a larger nose radius directly reduces the theoretical peak-to-valley height, allowing engineers to improve surface finish without sacrificing material removal rate.
This makes tool geometry a surface finish specification decision, not merely a machining convenience — the insert chosen at the tooling stage is part of the surface quality outcome.
Cutting speed also influences finish, but its relationship is more nuanced and material-dependent: at very low speeds, built-up edge (BUE) forms as workpiece material welds to the cutting edge, then periodically fractures and re-welds to the surface, producing an irregular, degraded texture.
Increasing cutting speed past the BUE-prone regime suppresses this mechanism and generally improves finish, though the optimal speed varies with the tool-material combination and cannot be generalised across all workpiece materials.
By contrast, depth of cut has a relatively minor influence on surface roughness — a counter-intuitive but practically valuable insight for production optimisation.
An engineer seeking to maximise material removal rate can increase depth of cut with comparatively little penalty to surface texture, whereas the same throughput gain achieved by raising feed rate will significantly coarsen the surface.
Post-Processing Operations and Their Effect on Roughness
When the roughness achievable by machining alone is insufficient for the functional requirement, post-processing operations can modify the surface texture substantially — and each technique carries a distinct profile of trade-offs beyond the roughness number itself.
- Grinding: Abrasive action significantly reduces Ra versus turned or milled surfaces, producing a finer, more uniform texture suited to bearing and sliding contact applications.
- Honing: Creates a characteristic cross-hatch pattern on cylindrical bores; the crossed lay retains lubricant, making it the standard finish for engine cylinders and hydraulic bores.
- Superfinishing and lapping: Achieves sub-micrometre Ra values through minimal, controlled material removal — used for precision bearing races and sealing surfaces where extreme smoothness is required.
- Shot peening: Deliberately increases surface roughness while inducing compressive residual stress, improving fatigue life by resisting crack initiation despite the coarser surface texture.
- Burnishing: Plastically deforms surface asperities without removing material, producing a smooth, work-hardened, compressively stressed surface in a single pass.
The pattern across these techniques reveals that roughness reduction and other surface properties are often in tension: honing retains a degree of controlled roughness specifically to hold lubricant, connecting directly to the lubrication regime and lambda ratio considerations established earlier in this guide.
Shot peening is the clearest example of a deliberate trade-off — it makes the surface measurably rougher, yet the compressive residual stress induced in the subsurface layer improves fatigue resistance by opposing crack initiation, a functional benefit that outweighs the roughness penalty in high-cycle fatigue applications.
Burnishing and superfinishing work in the opposite direction: both reduce roughness while simultaneously improving subsurface properties through work hardening and compressive stress, making them attractive where both smooth texture and surface integrity are required.
The Cost of Tighter Roughness Tolerances
Every step toward a finer surface finish carries a cost: slower feed rates mean longer cycle times, additional finishing passes consume machine capacity, finer abrasive grades require more controlled process conditions, and post-processing operations add steps to the production chain.
The engineering economics argument is straightforward — over-specifying surface finish wastes machining time and cost without delivering functional benefit, while under-specifying risks performance failure in service.
The engineering principle is to specify the roughness that the functional requirement demands, and nothing beyond it. Over-specifying surface finish adds machining time and cost without functional benefit; under-specifying risks performance failure. Fit-for-purpose specification is the goal.
This framing shifts roughness specification from a drawing convention into an engineering economics decision: the designer who understands the functional consequences of roughness — wear regime, sealing performance, fatigue life, adhesion — can make a reasoned case for exactly the tolerance the part needs.
Surface Texture in the Full Process Chain
Surface texture is not only a property of the finished part — it is an input to every subsequent process step, including coating application and adhesive bonding.
The roughness left by the final machining or surface preparation operation directly determines the mechanical interlocking and contact area available for a coating or adhesive, connecting back to the adhesion mechanisms discussed earlier in this guide.
This means roughness specification must be considered across the entire process chain — from design intent through machining parameters through surface treatment — not only at the point where a finished part is inspected against a drawing.
With the practical levers of surface finish control now mapped — from feed rate and tool geometry through post-processing and process chain management — the final step is to draw the threads of this guide together into a unified engineering perspective on surface roughness as a deliberate design decision.
Conclusion
Surface roughness as an engineering decision
What this guide has traced — from the vocabulary of surface texture through to the economics of post-processing — is really a single idea: that surface roughness is woven into every stage of the engineering process, from the first specification on a drawing to the moment a component meets its working environment.
The engineers who get the most from that understanding are the ones who treat roughness as a considered choice rather than an inherited default — and the next step, for any application, is simply to apply that same deliberateness to your own.
Frequently asked questions about surface roughness
Each answer below is self-contained and covers the most common questions practitioners have about surface roughness measurement, characterisation, and its effects in engineering and manufacturing.
In engineering, surface roughness refers to the fine-spaced, microscopic irregularities on a surface that result directly from the production process. It is distinct from waviness (longer-wavelength undulations caused by machine vibration or deflection) and form (the overall geometry of the part). Roughness is quantified using amplitude parameters such as Ra (arithmetic mean deviation) and Rz (mean peak-to-valley height), and is governed by standards including ISO 21920 for the profile method and ISO 25178 for the areal method. Unlike the everyday English sense of the word, engineering roughness is a precisely defined, measurable, and functionally significant property. A surface described as "rough" in casual language might be perfectly acceptable by its specification — or vice versa. The engineering definition ties roughness to a specific measurement method, a filter cutoff, and a reported parameter.
Ra is the arithmetic mean of the absolute height deviations from the mean line across the evaluation length — it averages the surface's vertical irregularities into a single value. Rz is the mean roughness depth: the average of the maximum peak-to-valley heights measured across successive sampling lengths, making it more sensitive to surface extremes such as isolated deep scratches, sharp peaks, or pronounced valleys. The practical difference is significant: Ra smooths out extremes through averaging, while Rz amplifies them. A surface with occasional deep scratches will show a disproportionately higher Rz relative to Ra compared with a uniformly textured surface of the same Ra. The two parameters are complementary — specifying both gives a more complete picture of surface character than either alone. One important note: the precise definition of Rz differs between ISO 21920 and ASME B46.1, so always cite the applicable standard when reporting or comparing Rz values across international contexts.
Roughness is the short-wavelength, fine-spaced component of surface texture — the microscopic irregularities produced directly by the cutting tool, abrasive, or other production process. Waviness is the longer-wavelength component: broader, more widely spaced undulations that typically arise from machine vibration, spindle deflection, or workpiece compliance during processing. The two are separated by filtering. The measured primary surface profile is passed through a filter at the cutoff wavelength λc: components shorter than λc are assigned to the roughness profile; components longer than λc (up to the waviness cutoff λf) form the waviness profile. This distinction matters practically — an instrument or filter setting that is sensitive to waviness-scale features can make an acceptable surface appear rougher than it is. Measuring and reporting the correct filtered component is essential for a specification to be meaningful.
Ra averages the absolute height deviations across the evaluation length, making it insensitive to the shape, spacing, and distribution of surface features. Two surfaces can share an identical Ra yet have entirely different peak sharpness, valley depth, feature spacing, and amplitude distribution — all of which directly influence functional behaviour in service. Several complementary parameters capture what Ra cannot. Rsk (skewness) reveals whether a surface is peak-dominated (positive skew) or valley-dominated (negative skew). Rku (kurtosis) describes the sharpness of peaks relative to the overall amplitude distribution. RSm (mean spacing of profile elements) quantifies how frequently surface features repeat along the measurement direction. A surface with high positive skewness — sharp, prominent peaks — will generate higher contact stress, accelerate wear, and produce more friction than a valley-dominated surface with identical Ra. For functional surfaces in tribological, sealing, or fatigue-sensitive applications, Ra alone is an incomplete quality indicator. Specifying additional parameters gives a specification that actually predicts performance.
Sealing surfaces require roughness controlled within a defined range rather than simply minimised. Too rough a surface creates leak paths along valleys that the seal cannot bridge; too smooth a surface can impair lubricant retention in dynamic seals or prevent an elastomeric seal from conforming and bedding correctly. Because Ra alone does not capture peak-to-valley extremes or the proportion of surface available for contact, sealing applications typically specify multiple parameters together. Ra or Rz controls the overall texture level, while Rmr (material ratio, also described through the Rk family of parameters in some standards) characterises how much of the surface is available for load-bearing contact with the seal. The appropriate values depend on the seal type — elastomeric O-ring, lip seal, face seal, or mechanical seal — as well as the fluid, operating pressure, and temperature. Consult the relevant seal manufacturer's technical guidance and the applicable standard for your specific application; values vary considerably and cannot be generalised across seal types.
Machining directly determines a component's initial surface texture, with feed rate and tool nose radius being the dominant variables. Higher feed rates produce coarser surfaces; a larger tool nose radius reduces roughness for any given feed rate. This kinematic relationship between feed, nose radius, and the resulting surface profile is well established in machining theory. Cutting speed has a secondary but real effect: too low a speed can cause built-up edge formation on the tool, which degrades surface quality unpredictably. Post-processing operations can substantially modify the roughness left by primary machining. Grinding reduces Ra significantly; honing produces a cross-hatch pattern that improves lubricant retention in bores; superfinishing and lapping achieve very low Ra values for precision bearing and sealing surfaces; shot peening increases roughness while inducing beneficial compressive residual stress. Surface roughness is therefore not a fixed outcome of a machining operation — it is governed by parameter choices at every stage and can be progressively refined through post-processing to meet the functional requirement.