

Introduction
As C-band capacity edges toward its limits on high-traffic routes, the L band has moved from a contingency option to an active engineering priority for operators and network planners worldwide.
This guide is written for engineers, network planners, and telecoms professionals who need a technically accurate reference rather than a surface-level overview.
It covers the L band's definition and wavelength range, its relationship to the C band, the amplification technology that makes it viable, how combined C+L systems expand DWDM capacity, the real-world constraints that complicate deployment, and the instrumentation requirements that are easy to overlook until they cause problems.
Note: this guide addresses the optical L band used in fibre optic and DWDM systems, not the RF L band associated with GPS and satellite communications.
TL;DR
The L band is not simply more C band — it is a commercially mature, technically distinct transmission window with its own amplifier design requirements, deployment constraints, and instrumentation needs.
Getting L-band deployment right means understanding where it differs from C-band assumptions, not just where it adds spectrum.
This article covers:

L band wavelength range and definition
L band and C band relationship explained
EDFA amplification enabling L-band transmission
C+L systems and expanded DWDM capacity
Deployment constraints in submarine networks
Test and measurement instrumentation requirements
What is L Band Wavelength?
The L band in fibre optic communications is the long wavelength transmission band defined by ITU-T, spanning 1565 to 1625 nm in the near-infrared region of the electromagnetic spectrum — making it one of the primary windows used for long-haul optical signal transmission through silica fibre.
The letter "L" stands for long wavelength, reflecting the band's position at the longer-wavelength end of the primary erbium-doped fibre amplifier (EDFA) gain spectrum — a naming convention formalised in ITU-T Supplement G.Sup39.
ITU-T G.Sup39 defines six named spectral bands for single-mode silica fibre transmission, each assigned a letter, a descriptor, and a precise wavelength range — together forming the framework within which all optical communications bands are discussed and standardised.
| Band | Descriptor | Wavelength Range (nm) |
|---|---|---|
| O-band | Original | 1260 – 1360 |
| E-band | Extended | 1360 – 1460 |
| S-band | Short wavelength | 1460 – 1530 |
| C-band | Conventional | 1530 – 1565 |
| L-band | Long wavelength | 1565 – 1625 |
| U-band | Ultra-long wavelength | 1625 – 1675 |
ITU-T G.Sup39 optical spectral band framework showing the L band's position relative to the O, E, S, C, L, and U bands, with precise wavelength ranges.
Within this framework, the L band sits immediately above the C band (1530–1565 nm) and immediately below the U band (1625–1675 nm); together, C and L form the principal transmission window exploited by DWDM systems, with both bands falling within the erbium gain spectrum that makes optical amplification practical.
The L band's commercial viability rests on a straightforward physical fact: silica fibre exhibits very low attenuation across this wavelength range, with Corning SMF-28 variants specifying maximum attenuation values of ≤0.20–0.23 dB/km at 1625 nm — confirming that signals at L band wavelengths can travel long distances through standard fibre with minimal loss.
One point of terminology worth addressing directly: the term "L band" is also used in radio-frequency and radar engineering to denote a microwave range of 1–2 GHz (wavelengths of roughly 15–30 cm), applied in GPS, satellite navigation, and radar systems. This is an entirely separate designation — it shares only a label with the optical L band, not a spectrum, a technology, or a physical medium. This guide addresses the optical/infrared L band exclusively.
The optical L band (1565–1625 nm, near-infrared) and the RF/radar L band (1–2 GHz, microwave) are completely unrelated designations in different domains of the electromagnetic spectrum. Engineers searching for optical fibre information should disregard any RF L band references.
In fibre optic communications, an L-band signal is an optical signal — light — transmitted at a wavelength within the 1565–1625 nm window through a silica fibre waveguide; in DWDM systems, multiple L-band signals are carried simultaneously, each assigned to a discrete nominal central frequency on the ITU-T G.694.1 grid.
The L band does not operate in isolation — its practical significance in network design is most clearly understood alongside its immediate neighbour, the C band, which arrived first and still carries the majority of DWDM traffic; the next section examines how the two bands relate, where they differ, and why that adjacency matters for capacity planning.
The L Band and the C Band: Adjacency and Differences
Understanding why the L band exists as a distinct commercial window requires understanding why the C band came first — and the answer is rooted in two pieces of physics converging on the same 35 nm of spectrum.
The C band (1530–1565 nm) became the foundation of commercial DWDM because it coincides with both the gain peak of erbium-doped fibre amplifiers (EDFAs) — the technology that made long-haul WDM economically viable — and the minimum attenuation point of standard silica single-mode fibre, as confirmed by ITU-T G.652.
That convergence drove rapid ecosystem development throughout the 1990s: components, transponders, ROADMs, and amplifiers were all engineered around C-band wavelengths, compounding the band's dominance well into the 2000s.
The L band is not a competing alternative to C band — it is the immediately adjacent window on the longer-wavelength side, and the natural continuation once C-band capacity begins to fill. Together, C+L covers approximately 1530–1625 nm, roughly doubling the usable DWDM transmission spectrum compared to C band alone.
One real physical difference between the two windows is fibre loss: ITU-T G.652 representative link values place typical attenuation at 0.275 dB/km across the C-band (1530–1565 nm) and 0.35 dB/km across the L-band (1565–1625 nm). That margin is meaningful but not prohibitive — EDFA amplification covers both bands commercially, and the loss penalty has not prevented L-band deployment at scale.
The more technically interesting distinction involves dispersion-shifted fibre (DSF), a fibre type standardised as ITU-T G.653 that was designed to place the zero-dispersion wavelength at 1550 nm — directly inside the C-band DWDM window.
DSF was originally attractive for single-channel transmission at 1550 nm, but it created a serious problem when DWDM was introduced: four-wave mixing (FWM) — a nonlinear crosstalk mechanism — requires phase matching between co-propagating channels, and phase matching is most easily satisfied when chromatic dispersion is near zero. On DSF, C-band DWDM channels sit almost exactly at the zero-dispersion crossing, making FWM crosstalk severe and multichannel operation highly impaired.
The L band sidesteps this problem. On DSF, L-band wavelengths exhibit non-zero dispersion — the Lightwave Online L-band amplifiers article notes explicitly that at L-band wavelengths DSF "exhibits nonzero dispersion and is fit for multichannel DWDM operation." That residual dispersion disrupts the phase-matching condition for FWM, suppressing crosstalk and making DWDM viable on DSF infrastructure that C band cannot serve well.
The Lightwave Online amplifiers article (1590-nm EDFA) cites chromatic dispersion of approximately 3 ps/(km·nm) at 1590 nm on DSF, compared to roughly 0.05 ps/(km·nm) at 1550 nm — a 60-fold increase in residual dispersion that is large enough to suppress FWM while remaining small enough to support high data rates over long spans.
This DSF advantage was one of the original commercial motivations for L-band deployment. The IEEE Xplore survey (document 9893169) confirms that the L band was commercialised in the early 2000s, driven by two parallel pressures: the need to double WDM channel count on standard single-mode fibre as C-band capacity began to fill, and the need to enable DWDM on the installed base of DSF infrastructure where C-band FWM was a hard limit.
With the C/L relationship established — why C band came first, where the two bands differ physically, and why L band is the logical complement rather than a replacement — the next question is how that complementary relationship is actually exploited in DWDM system design to expand fibre capacity.
L Band in WDM and DWDM: Expanding Fibre Capacity
For most operators, the C band has been progressively filled through successive generations of improvement: modulation rates climbing from 10G to 100G to 400G, channel spacing tightening from 100 GHz to 50 GHz, and coherent DSP squeezing ever closer to the Shannon limit on spectral efficiency. With those levers largely exhausted, the question facing network planners is how to add capacity without the capital and time cost of deploying new fibre — and the answer, for a growing number of operators, is the L band.
The arithmetic is straightforward. The C band provides approximately 4.8 THz of usable WDM spectrum. Adding the L band brings the total to approximately 9.6 THz — effectively doubling the channel capacity available on an existing fibre pair without touching the physical infrastructure.
| Configuration | Usable Spectrum | Capacity vs C-band alone |
|---|---|---|
| C band only | ~4.8 THz | Baseline |
| C + L band (conventional) | ~9.6 THz | ~2x |
Spectrum arithmetic comparison between C-band-only and C+L configurations, using figures from Nokia and Ciena technical sources.
This doubling is grounded in the ITU-T G.694.1 frequency grid, which governs DWDM channel allocation across both bands. The grid is anchored to 193.1 THz and supports standard channel spacings of 12.5, 25, 50, and 100 GHz — the same spacings used in C-band planning. L-band channels slot directly into this framework, so operators do not need a separate channel management paradigm for the new band.
The pay-as-you-grow deployment model reflects this continuity in practice. Operators deploy C-band equipment first, then add L-band amplifiers and transceivers to existing ROADM and in-line amplifier (ILA) sites when C-band headroom is exhausted. The fibre infrastructure and the ROADM sites are already in place; L-band capability is layered on modularly, avoiding stranded investment in new physical plant.
There is also a distinct use case on legacy dispersion-shifted fibre (DSF) infrastructure. As established in the previous section, the L band's non-zero dispersion on DSF makes it viable for multichannel DWDM on fibre types where C-band deployment is impractical due to severe four-wave mixing nonlinear effects.
C+L Deployment in Practice
Named operator deployments confirm that C+L is a commercially mature capacity expansion path, not an emerging technology. Nokia completed a field trial with Philippine operator Globe Telecom demonstrating 600 Gbps channels in the C band and 400 Gbps channels in the L band on Globe's live optical network, scaling total network capacity to 54.4 Tbps over C+L using Nokia's 1830 Photonic Service Switch platform — with the existing C-band system upgraded to C+L in-service by adding L-band components.
US carrier Windstream deployed Infinera's C+L solution to add L-band capability to its fibre network, with the explicit goal of doubling fibre capacity on high-growth routes. Windstream's chief network officer noted the ability to fill C-band capacity first, then expand into L band without disrupting existing traffic — a direct expression of the pay-as-you-grow model in a production network.
Telia Carrier deployed Ciena's 6500 Reconfigurable Line System — an integrated C+L photonic line system — to double usable signal spectrum across its US footprint, serving web-scale and enterprise customers. The Ciena platform integrates both C- and L-band functions, allowing Telia Carrier to expand into L band without impacting in-service C-band channels.
Nokia's Globe Telecom trial, Windstream's Infinera deployment, and Telia Carrier's Ciena RLS rollout each demonstrate the same decision: operators facing C-band exhaustion are choosing C+L over new fibre construction. The deployment model is proven, the equipment is generally available, and the capacity outcome — approximately 9.6 THz versus 4.8 THz — is consistent across vendors and network types.
What these deployments collectively demonstrate is that C+L has moved well past the trial phase. Operators across different geographies and network architectures are making production commitments, and multiple vendor platforms — Nokia 1830 PSS, Infinera FlexILS, Ciena 6500 RLS — are in active deployment.
Understanding why operators can deploy L band is the logical next question: the capacity case and the deployment model are clear, but L-band transmission across long-haul spans requires amplification technology specifically engineered for the 1565–1625 nm window — and that is where the design of L-band EDFAs becomes critical.
EDFA Amplification in the L Band: How It Works
Without optical amplification, the L band would remain commercially inert — a wavelength range with no practical way to compensate for transmission losses across any meaningful fibre span. The erbium-doped fibre amplifier (EDFA) is what makes L-band transmission viable, and understanding how it works in this band reveals why L-band systems require a materially different amplifier design from their C-band counterparts.
An EDFA works by splicing a length of erbium-doped fibre into the signal path and injecting pump light — typically at 980 nm or 1480 nm — to excite the Er³⁺ ions into the ⁴I₁₃/₂ metastable state.
Signal photons passing through the doped fibre trigger stimulated emission: the excited ions release coherent photons at the signal wavelength, amplifying the signal entirely in the optical domain without any electrical conversion.
The erbium gain window in silica glass spans roughly 1530–1625 nm — wide enough to cover both the C band and the L band from the same gain medium, which is the physical foundation for everything that follows.
C Band at the Peak, L Band at the Tail
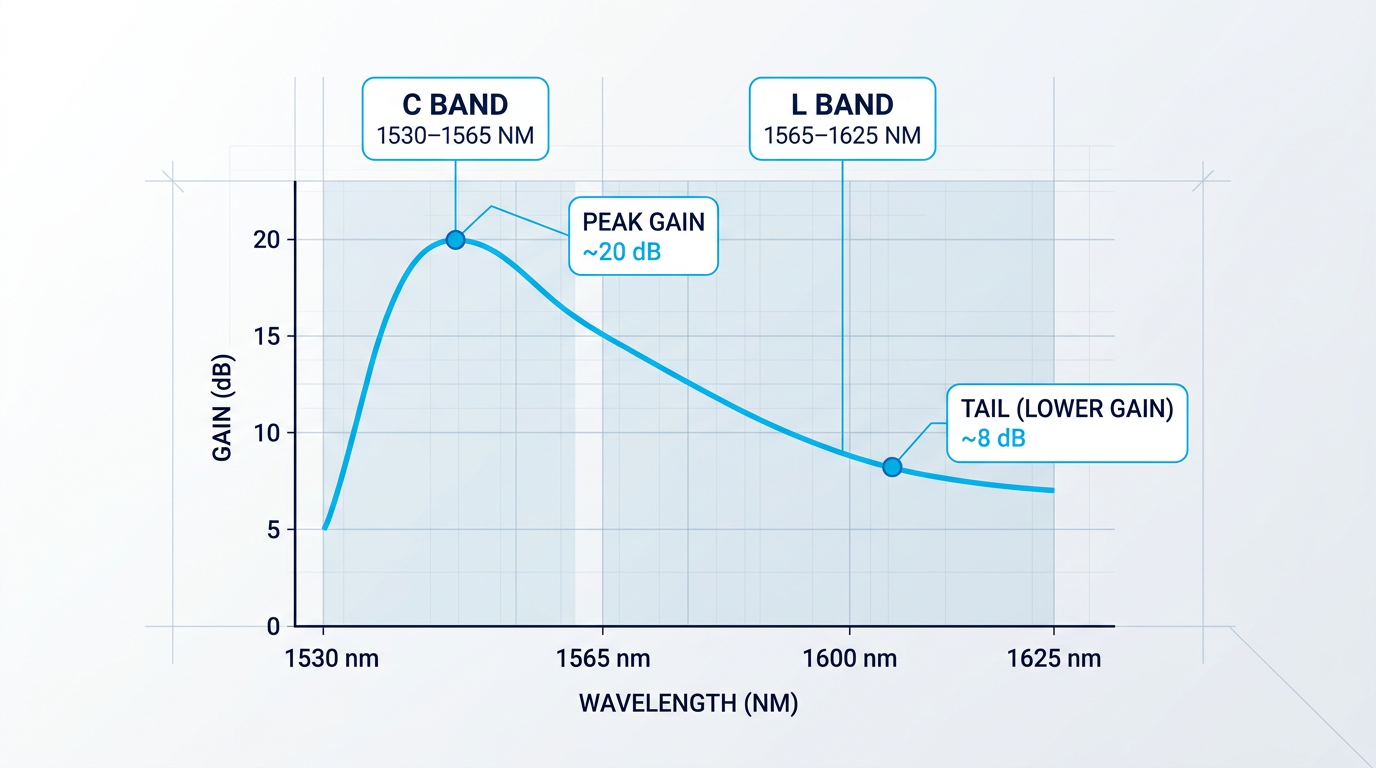
The C band (1530–1565 nm) sits at the peak of the erbium gain spectrum, where emission cross-sections are highest, gain per unit fibre length is greatest, and noise performance is at its best — which is precisely why the C band was commercialised first.
The L band (1565–1625 nm) occupies the tail of that same gain spectrum, where emission cross-sections are substantially lower — three to four times smaller than the corresponding C-band values, according to published amplifier characterisation data.
This single physical fact — lower emission cross-sections in the L band — is the root cause of every design difference between a C-band EDFA and an L-band EDFA.
Longer Fibre, Lower Inversion: The Core Design Difference
Because the gain coefficient in the L band is substantially lower, an L-band EDFA must use a considerably longer length of erbium-doped fibre to achieve equivalent gain — typically four to five times longer than a comparable C-band amplifier using standard erbium-doped fibre.
Equally important, L-band EDFAs operate at a much lower population inversion level: around 40% average inversion, compared to 60–65% for C-band amplifiers.
L-band EDFAs are intentionally engineered to operate in a low-inversion regime that a C-band EDFA would treat as under-pumped. At lower inversion, the erbium gain peak shifts toward longer wavelengths — directly into the L-band window. The amplifier exploits this shift rather than fighting it.
The practical consequence of lower inversion is a higher noise figure — measured data from L-band EDFA prototypes shows a noise figure approximately 1 dB greater than optimised C-band equivalents, a direct result of operating further from the gain peak.
Gain flatness is a further engineering challenge: across the 1565–1625 nm window, different channels receive different levels of amplification unless corrected, requiring gain flattening filters (GFFs) to equalise channel powers.
One partial compensation is that the L-band gain ripple is intrinsically lower than in the C band — measured at approximately 1.4% for L-band versus 4–6% for C-band — which means L-band GFFs are somewhat easier to manufacture and introduce less insertion loss penalty than their C-band counterparts.
Multi-Stage Design and ASE Management
Amplified spontaneous emission (ASE) is a more significant challenge at the tail of the gain spectrum than at the peak: the longer fibre lengths required for L-band amplification give ASE more distance to accumulate, and the shorter-wavelength ASE generated within the erbium gain window can saturate the amplifier before adequate signal gain is reached.
Multi-stage amplifier architectures — with inter-stage optical filtering to strip ASE between gain sections — are the standard engineering response for demanding L-band applications.
- Inter-stage bandpass filtering: A narrowband filter between gain stages suppresses short-wavelength ASE before it enters the second stage and is amplified further.
- Independent stage optimisation: Splitting C and L bands into parallel gain sections allows each to be independently optimised for inversion level, fibre length, and noise figure.
- GFF placement between stages: Positioning the gain flattening filter between stages, rather than at input or output, minimises both noise figure penalty and power conversion loss.
These are not exotic workarounds — they are well-established design practices that allow L-band EDFA performance to approach that of advanced C-band amplifiers in terms of gain, output power, and channel uniformity.
C+L Coverage from a Single Erbium-Fibre Platform
Because both bands fall within the erbium gain window, a single erbium-fibre amplifier platform can, in principle, cover C and L simultaneously — without switching to a different gain medium or a fundamentally different technology.
For system planners deploying C+L DWDM capacity, this is architecturally significant: unified platform coverage simplifies integration and reduces the complexity of managing separate amplifier chains for each band.
Our Custom EDFA is one concrete implementation of this principle — delivering both C-band and L-band from a single erbium-fibre source through one cable, engineered end-to-end across operating band, output power, form factor, and control firmware rather than adapted from a fixed C-band catalogue design.
For demanding L-band applications — whether the requirement is operating band, output power, integration envelope, or noise budget — an amplifier purpose-engineered to the specific application consistently outperforms a fixed-catalogue part stretched beyond its original design intent.
Understanding how L-band EDFAs work is the prerequisite for understanding where they run into real-world constraints — particularly in submarine systems, where amplifier chain design, power budgets, and physical space all become critical variables.
Custom EDFAs Engineered for L-Band Performance
L-band amplification demands a different approach to EDFA design. Explore tailored EDFA solutions built for the specific gain, power, and wavelength requirements your system calls for.

L Band in Submarine and Terrestrial Networks: Real Constraints
Adding L-band capacity to an existing fibre can look deceptively straightforward on paper — more spectrum, same fibre, doubled capacity. The submarine environment strips that simplicity away and exposes engineering constraints that simply do not exist on land.
The foundational challenge in any repeatered submarine cable system is power delivery. Unlike terrestrial networks, where electrical power can be supplied locally at each amplifier site, subsea repeaters must be powered remotely via a shore-end power feed — a constant DC current driven through the cable itself from equipment on land, over distances of hundreds to thousands of kilometres.
This creates a strict per-repeater power budget that has no terrestrial equivalent. As SubTelForum's analysis of submarine fibre systems notes, electrical power constraints are the reason submarine systems have historically operated with relatively low fibre counts — every amplifier added to the wet plant draws from the same constrained shore-end source.
Introducing L-band amplification into a submarine repeater compounds this directly. A separate, parallel amplifier chain dedicated to the L band is required — the C-band EDFA cannot simply be extended to cover both bands within the repeater housing. As TE SubCom confirmed when commencing manufacture of C+L technology, this means physically adding a second length of erbium-doped fibre in the undersea repeaters to provide amplification for L-band wavelengths.
That parallel chain draws additional power from the already-constrained shore-end feed, making it the primary adoption barrier in submarine C+L systems — not a theoretical concern, but the specific engineering reality that makes submarine L-band deployment significantly harder than its terrestrial counterpart.
Physical space adds a further complication. Submarine repeater housings are compact pressure vessels with tightly constrained internal volume, and accommodating an additional amplifier stage is a non-trivial integration challenge on top of the power problem — though it is secondary to the power budget as the binding constraint.
The terrestrial picture is markedly different. At in-line amplifier (ILA) sites on land, power is available locally — there is no shore-end feed to exhaust. L-band amplifiers can be added modularly to existing C-band ILA infrastructure as a pay-as-you-grow upgrade, scaling link by link and node by node without disrupting in-service C-band traffic.
The power budget constraint that governs every design decision in submarine C+L deployment simply does not exist in terrestrial networks — which is why terrestrial C+L adoption has consistently moved faster than its submarine equivalent.
Despite these constraints, submarine C+L is progressing. The engineering challenges are real, but they are being solved by the industry's leading system integrators.
NEC demonstrated 50.9 Tb/s over more than 11,000 km on a single optical fibre using C+L band EDFAs — the first time 50 Tb/s had been achieved over 10,000 km with this amplifier architecture, representing a capacity-distance product of 570 Pb-km. Separately, Ciena's GeoMesh Extreme solution now supports L-band operation on TE SubCom's C+L wet plant, with the parallel amplifier chain integrated into the submarine repeater design and managed from a unified platform — a commercial system, not a laboratory demonstration.
Beyond the power and space constraints specific to submarine systems, C+L deployments in any environment must contend with stimulated Raman scattering (SRS). SRS is a nonlinear effect in optical fibre that causes power to transfer from shorter wavelengths to longer ones — meaning C-band channels progressively lose power to L-band channels as signals propagate, creating a gain tilt across the combined spectrum.
Left unmanaged, this inter-band power transfer causes C-band channels to suffer reduced optical signal-to-noise ratio while L-band channels receive excess power — degrading performance across both bands. Modern C+L line systems address this through self-tuning gain tilt correction, dynamically adjusting per-channel power levels across both bands at each amplifier site without operator intervention.
The broader engineering principle that emerges from these constraints is clear: L-band amplifiers intended for demanding applications — submarine deployments, high-power configurations, or tightly integrated form factors — perform best when engineered specifically for the L-band operating envelope, rather than adapted from a C-band design that was never optimised for the longer-wavelength gain region.
Deployment constraints extend beyond the amplifier chain itself — the instruments used to commission, verify, and monitor L-band systems carry their own compatibility requirements, which the next section addresses.
Test and Measurement in the L Band: Instrumentation Requirements
There is a trap that catches engineers moving from C-band-only environments into L-band deployments: the test instruments they have relied on for years are typically calibrated and specified for C-band operation, meaning their accurate measurement range ends at approximately 1565 nm — the exact point where the L band begins.
Four instrument categories are affected in distinct ways: optical spectrum analysers, OTDRs, power meters, and light sources — and each presents a different kind of measurement risk.
Optical Spectrum Analysers
An optical spectrum analyser specified only to 1565 nm cannot see L-band channels at all — the wavelengths fall outside its measurement window, so the failure is at least visible: the channels simply do not appear.
For simultaneous C+L band monitoring, an OSA must cover the full combined window across both bands; instruments designed for this purpose are explicitly specified for extended wavelength coverage, and verifying that specification against the datasheet — rather than assuming it — is the critical step before commissioning.
OTDRs and In-Service Fibre Characterisation
L-band OTDR testing is typically performed at 1625 nm, a wavelength chosen specifically because it sits outside the C-band transmission window, allowing in-service fibre characterisation without disrupting live traffic.
Fibre characterised only at 1310 nm and 1550 nm may not reveal macrobend-related losses that become significant at longer wavelengths; the 1625 nm test wavelength probes the fibre in a regime much closer to L-band operating conditions, exposing bend-sensitive attenuation that standard test wavelengths can miss entirely.
Not all OTDR platforms include a 1625 nm test wavelength as standard — it is typically available as a module or configuration option, and confirming its presence before deployment is essential for any L-band fibre characterisation programme.
Power Meters and Light Sources
Standard telecom power meters are calibrated at 1310 nm and 1550 nm; without an explicit L-band calibration point — typically 1625 nm — readings at L-band wavelengths carry a calibration uncertainty that the instrument does not flag and the operator may not notice.
The same applies to light sources used for insertion loss testing: a source specified only at 1550 nm cannot reliably characterise fibre or passive components at 1625 nm, regardless of whether it produces an output signal at that wavelength.
With an OSA, an out-of-range wavelength produces no reading — the problem is obvious. With a power meter or light source lacking an L-band calibration point, the instrument produces a number that looks correct. Engineers acting on that number are not working from bad data they can see; they are working from bad data they cannot.
Addressing this requires a deliberate verification step across every instrument in the test chain before an L-band deployment begins — not a check that happens once the anomalies appear.
- Optical Spectrum Analyser: Verify wavelength coverage explicitly extends across the full C+L window; an OSA limited to 1565 nm cannot detect L-band channels.
- OTDR: Confirm 1625 nm is available as a built-in or module option; 1310/1550 nm testing will not reveal L-band macrobend losses.
- Power Meter: Confirm an explicit L-band calibration point, typically 1625 nm; without it, readings carry unquantified error that appears valid.
- Light Source: Confirm specified output wavelength covers the L-band range; a 1550 nm-only source cannot reliably characterise components at 1625 nm.
Engineers who have commissioned L-band systems know this verification step from experience; those arriving from C-band-only backgrounds often encounter the gap mid-deployment, when the cost of diagnosis is considerably higher than the cost of prevention.
With the engineering and instrumentation picture now complete, the final question is where L-band adoption actually stands commercially — which operators have committed to it, and what the deployment trajectory looks like from here.
L Band Today: Commercial Deployments and What Comes Next
C+L-band deployment has moved decisively from emerging technology into commercial service — a shift visible not in roadmaps, but in named operators running live traffic across both bands today.
Several major terrestrial operators have deployed C+L systems in production networks, supplied primarily by Ciena, Nokia, and Infinera.
- Colt Technology Services: Became the first provider to deploy 800G technology in the L-band across a terrestrial production network, using Ciena's RLS and WaveLogic 5 Extreme.
- Telia Carrier: Deployed Ciena's integrated C&L-band 6500 RLS to double usable signal spectrum and expand its US footprint for web-scale and enterprise customers.
- Bharti Airtel: Implemented an advanced C&L-band infrastructure using Ciena's 6500 RLS across India's largest metros to nearly triple fibre capacity and support 5G rollout.
- Aureon: Deployed Nokia's 1830 GX platform with Super C and L-band optical line system, connecting a North Dakota data centre to Chicago with capacity scaling to 400 Tb/s.
The demand driving these deployments is structural rather than cyclical. Cloud providers' optical transport spending jumped 46% in Q4, with cloud operator spending on optical transport equipment surpassing $750 million in that quarter alone, according to Cignal AI — a figure that reflects the scale of hyperscaler infrastructure investment now flowing into long-haul optical networks.
Google and Facebook were among the first to commercialise C+L-band transmission, doing so initially in subsea networks — a fact confirmed by Nokia's white paper on C+L deployment history.
As per-channel rates have reached 800G and 1.6T per wavelength, AI and cloud infrastructure growth has pushed terrestrial operators to treat L-band capacity as a day-one design requirement rather than a future capacity relief option.
By 2024, L-band was described as a must-have from day one in integrated C+L-band line system deployments — a shift in operator planning posture that reflects how thoroughly AI and cloud traffic growth has reframed capacity strategy.
The spectrum roadmap itself continues to extend beyond the conventional 9.6 THz C+L baseline (4.8 THz per band).
Ciena's analysis identifies extended configurations reaching 10.8 THz (extended C plus shifted L) and 12 THz (extended C plus extended L), though the same analysis notes that the conventional 9.6 THz configuration remains the most efficient choice for most deployments today given supply chain maturity and performance trade-offs.
At the research frontier, Fujitsu and KDDI Research demonstrated multiband wavelength multiplexed transmission across the O, S, C, L, and U bands using installed optical fibre in December 2023, achieving 5.2 times the wavelength multiplicity of conventional C-band-only transmission — a result that signals where the longer-term spectrum roadmap is heading.
In subsea networks, the constraints covered earlier in this guide are real, but the technology is progressing toward operational readiness despite them.
TE SubCom brought its C+L wet plant technology to the production stage in 2017, with Ciena's GeoMesh Extreme subsequently adding L-band capability to operate on that wet plant — nearly doubling the information-carrying capacity of a submarine cable.
NEC demonstrated a transmission capacity of 50.9 Tb/s on a single optical fibre over more than 11,000 km — the first time 50 Tb had been achieved over 10,000 km using C+L band EDFAs — establishing the technical feasibility of C+L at transoceanic distances.
On the operational side, integrated C+L amplifier architectures have substantially reduced the engineering friction that previously made L-band upgrades disruptive to in-service C-band traffic.
Ciena's 6500 RLS, for instance, uses integrated ASE noise loading to pre-optimise the photonic layer across both bands from the point of initial deployment, eliminating the need for amplifier site visits when L-band traffic is later activated — a maturity signal as significant as the named deployments themselves.
With the adoption picture now established — terrestrial C+L systems in commercial service, subsea deployments progressing toward operational readiness, and the spectrum frontier actively extending further — the guide's final section draws together the key takeaways for engineers and network planners working with these systems.
Tailored EDFAs for L-Band and Beyond
C+L-band deployment demands amplifiers built for the job. Explore custom EDFA solutions designed for the specific gain profiles, wavelength ranges, and power requirements your network requires.

Conclusion
Understanding the L Band: Key Takeaways
The L band is no longer a contingency plan — it is active infrastructure, carrying live traffic on routes where C-band capacity has run its course.
What this guide has tried to make clear is that deploying it well is a deliberate act: the amplifier design, the instrument specifications, the power budget — none of these are details you can revisit after the fact.
Engineers who go in with that understanding tend to build systems that perform as intended. Those who treat the L band as simply more C band tend to find out why it isn't.
L Band Wavelength: Frequently Asked Questions
Quick-reference answers to the most common technical questions about L band wavelength in fibre optic communications.
The optical L band spans approximately 1565 to 1625 nm, as defined by ITU-T Supplement G.sup39. It takes its name from "long wavelength" — the designation reflecting its position at the upper end of the standard fibre optic spectral framework. This places it immediately above the C band (1530–1565 nm) and within the broader low-loss transmission window of silica fibre, making it a practical range for long-haul optical communications.
An L-band signal in fibre optic communications is an optical signal transmitted at a wavelength within the 1565–1625 nm range. In DWDM systems, multiple L-band signals are carried simultaneously on separate ITU-T grid wavelengths within this window, each on its own distinct channel. Note that in radar and satellite contexts, "L-band signal" refers to a radio-frequency signal in the 1–2 GHz range — an entirely different part of the electromagnetic spectrum with no relation to the optical L band in fibre systems.
The C band (1530–1565 nm) sits at the peak of the erbium gain spectrum and benefits from slightly lower fibre attenuation; the L band (1565–1625 nm) operates on the tail of that gain curve, requires longer erbium-doped fibre lengths in its amplifiers, and is better suited to DWDM on dispersion-shifted fibre. The two bands are not alternatives — they are complementary. Deployed together on a single fibre pair, C and L bands approximately double the available WDM spectrum, which is precisely why operators add L band once C-band capacity is exhausted rather than choosing between them.
The C band became the first commercial DWDM window because it coincides with the EDFA gain peak and the lowest attenuation point in standard silica fibre. That combination of mature amplification technology and minimum signal loss gave it an insurmountable head start. The entire ecosystem of EDFAs, ROADMs, transceivers, and optical monitoring tools was built around C band over several decades of commercial deployment. The L band is not a replacement for C band — it is deployed alongside it to expand capacity once C-band channels are exhausted. A network running both bands roughly doubles the usable spectrum on each fibre pair.
In radar and satellite communications, the L band refers to the radio-frequency range of 1–2 GHz (corresponding to wavelengths of approximately 15–30 cm). It is used in GPS, satellite navigation systems, air traffic control radar, and certain mobile communications applications. This is an entirely separate use of the term from the optical L band in fibre optic communications, which spans 1565–1625 nm in the infrared. The two share only the label — they occupy completely different regions of the electromagnetic spectrum and serve different application domains.
No. Standard C-band EDFAs are designed and optimised for the 1530–1565 nm window and do not provide gain across the L band. L-band EDFAs require a fundamentally different design: longer erbium-doped fibre, lower population inversion levels, and different gain flattening filters to achieve usable gain across the 1565–1625 nm range. For systems requiring both bands, amplifiers must be specifically designed or specified for C+L operation. A C-band-only amplifier installed in an L-band or C+L system will simply not amplify the L-band channels — the signals will experience loss without any compensating gain across that portion of the spectrum.