

Introduction
If you are working through a design or specification decision involving a fibre amplifier, and you want to understand the underlying mechanics rather than just the datasheet numbers, this walkthrough is for you.
By the end, you will be able to trace the full amplification sequence from start to finish and reason about how each stage shapes the performance characteristics that matter in practice — noise figure, output power, gain flatness, and more.
The walkthrough is structured as a cause-and-effect chain because that is how the physics actually works: each stage is only possible because the previous one has been completed, and the page is organised to reflect that progression.
TL;DR
EDFA amplification is a coherent cause-and-effect chain. Every performance characteristic — noise figure, output power, gain shape — traces back to specific, knowable stages in that chain. Understanding each link is what lets an engineer reason through design decisions, rather than simply follow received rules.
This article covers:

What erbium-doped fibre is as a material
How pump light is absorbed by erbium ions
Population inversion and why it enables gain
How stimulated emission produces signal amplification
Pump configuration and wavelength selection trade-offs
Managing ASE and flattening the gain spectrum
What Is Erbium-Doped Fiber?
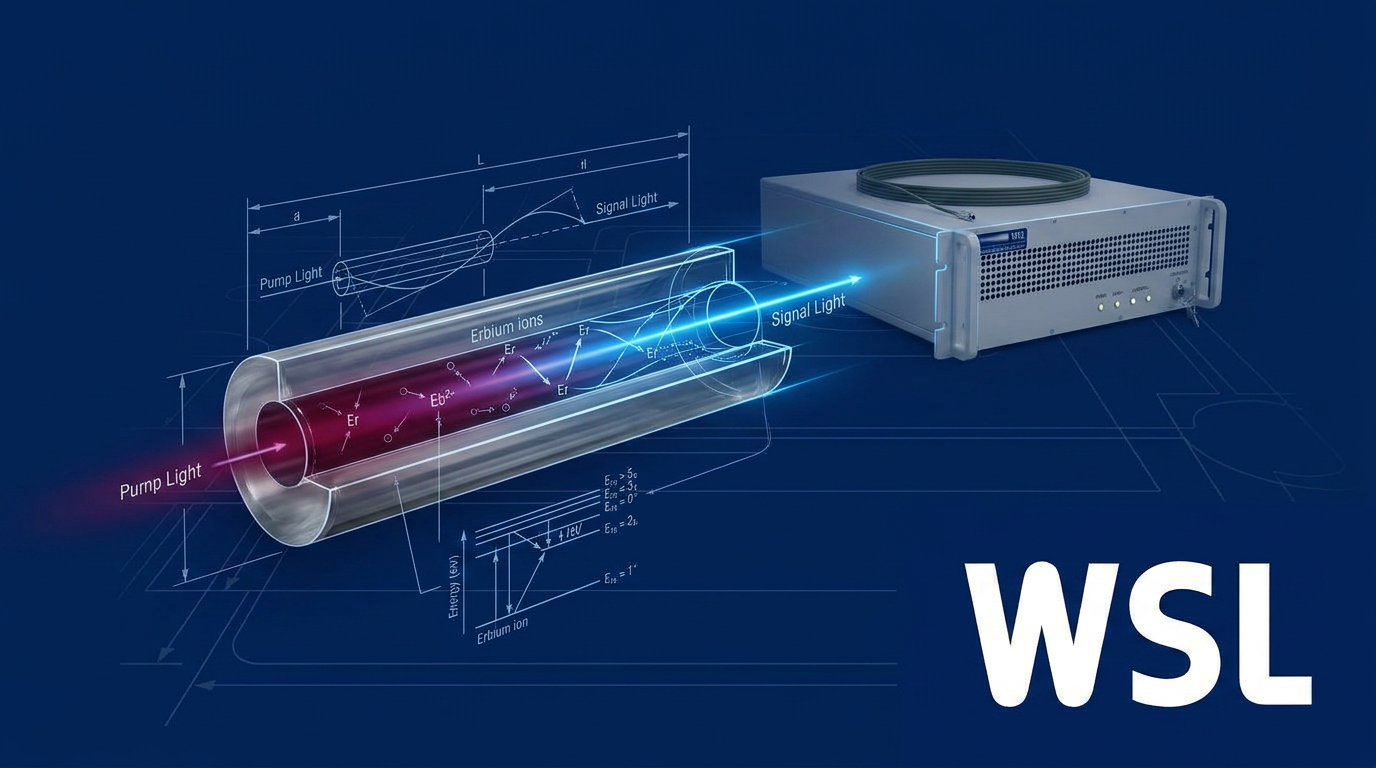
Most optical fibres are passive waveguides — they guide light but do nothing to it. Erbium-doped fibre (EDF) is categorically different: it is an active gain medium whose behaviour is governed not just by its waveguide geometry but by the quantum-mechanical properties of rare-earth ions embedded in its core.
Structurally, EDF is a silica optical fibre in which trivalent erbium ions (Er³⁺) are incorporated into the core glass during fabrication. These ions are the active gain species — they absorb pump photons and, under the right conditions, emit signal-wavelength photons through stimulated emission.
The Role of the Silica Glass Host
The amorphous (non-crystalline) structure of silica glass is not a passive container for the Er³⁺ ions — it actively shapes their optical behaviour through a mechanism called inhomogeneous broadening.
Because each Er³⁺ ion occupies a slightly different local glass environment, its energy transitions are shifted by slightly different amounts relative to its neighbours. As the Stanford EDFA technical report notes, it is precisely this amorphous structure that gives rise to the broad gain and emission spectrum of the EDFA — a property that is not intrinsic to the isolated erbium ion but emerges from the ion–host interaction.
The practical consequence is a broad, smooth gain spectrum rather than a narrow discrete emission line — which is what makes EDFAs well-suited to wavelength-division multiplexed (WDM) systems carrying many channels simultaneously across a single fibre.
Energy Levels of Er³⁺ in Silica
Er³⁺ in silica glass operates as a three-level system, with three energy manifolds doing the essential work of amplification.
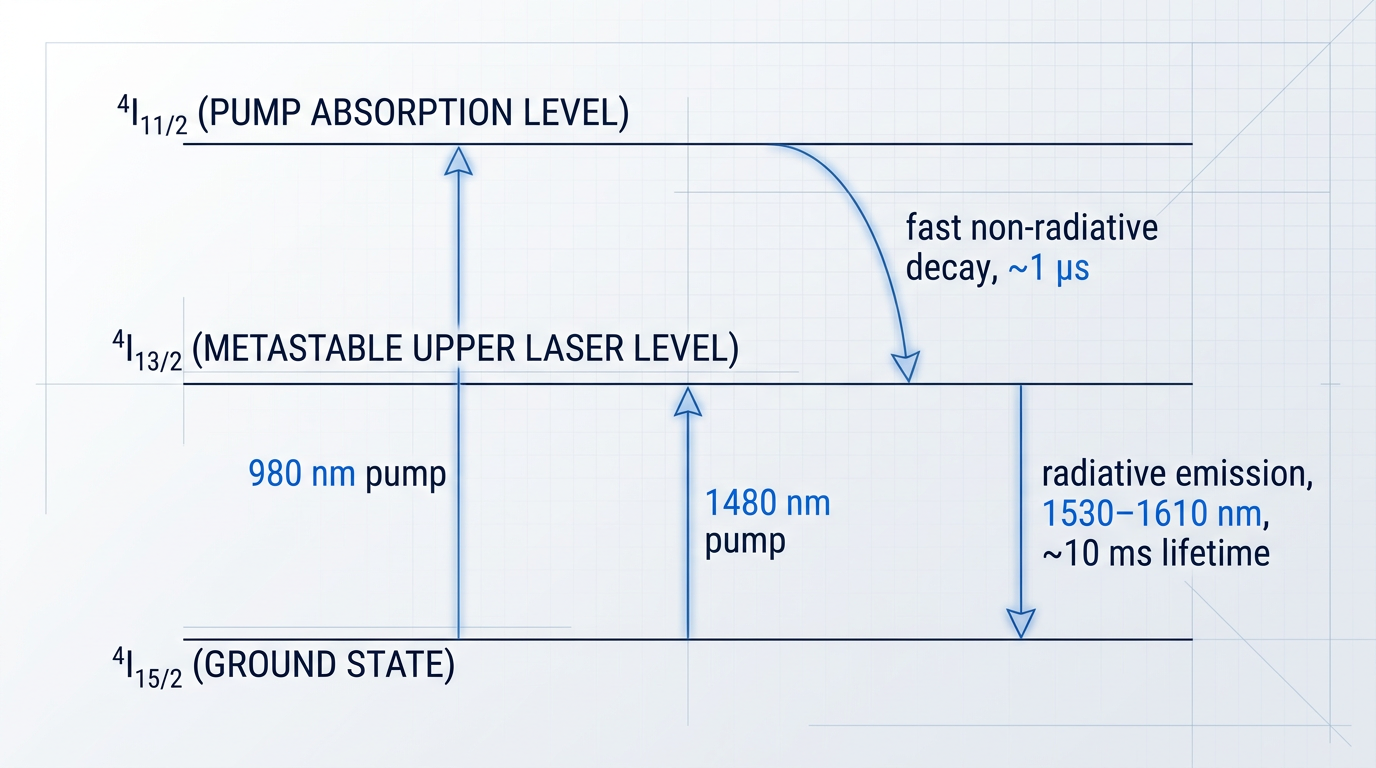
The ⁴I₁₅/₂ manifold is the ground state — where all Er³⁺ ions reside at thermal equilibrium. A 980 nm pump photon drives an ion from this ground state up to the ⁴I₁₁/₂ pump absorption level, from which it decays rapidly and non-radiatively (in approximately 1 µs) down to the ⁴I₁₃/₂ level.
The ⁴I₁₃/₂ manifold is the critical one: it is the metastable level, the upper laser level from which stimulated emission occurs. Its radiative lifetime in silica glass is approximately 10 ms — several orders of magnitude longer than the decay from ⁴I₁₁/₂ — which allows ions to accumulate there at moderate pump powers without requiring extremely high pump intensities.
When pumped at 1480 nm instead of 980 nm, ions are driven directly into the lower edge of the ⁴I₁₃/₂ manifold, bypassing the ⁴I₁₁/₂ level entirely — a quasi-two-level scheme with its own noise and efficiency characteristics, which the pump wavelength selection step will address in detail.
The radiative transition from ⁴I₁₃/₂ back down to ⁴I₁₅/₂ produces photon emission across the 1530–1610 nm wavelength range — and this is where the EDFA's significance becomes clear.
The ⁴I₁₃/₂ → ⁴I₁₅/₂ emission band of Er³⁺ in silica coincides almost exactly with the minimum-loss transmission window of silica optical fibre — the C-band and L-band, where standard single-mode fibre achieves attenuation of roughly 0.20 dB/km at 1550 nm. This alignment is the fundamental reason EDFAs displaced competing amplifier technologies: they amplify light precisely where fibre loses the least of it.
The two primary operating windows are the C-band (approximately 1530–1565 nm) and the L-band (approximately 1565–1625 nm). The gain spectrum of Er³⁺ in pure silica does not uniformly cover the full C-band width, but aluminium (Al) or phosphorus (P) co-doping of the host glass modifies the local environment around the Er³⁺ ions and broadens the emission spectrum to fully cover the C-band — with a FWHM of approximately 50 nm in Al/P-doped silica fibres, according to Lehigh University research.
Co-dopant selection is a practical design variable controlled at the fibre fabrication stage, and it directly influences gain flatness across WDM channels — a theme the gain-flattening step will return to later.
Fibre Parameters That Govern Amplifier Performance
Four physical parameters define the design space of an erbium-doped fibre and set the boundaries within which an amplifier engineer works.
- Erbium ion concentration: Sets gain per unit length. Higher concentration means more active ions per metre, but is bounded by concentration quenching effects (see below).
- Fibre length: Determines total pump absorption and the cumulative distance over which signal photons interact with excited ions, setting overall gain.
- Absorption coefficient: Quantifies how efficiently pump power (at 980 nm or 1530 nm) is converted into excited Er³⁺ ions per unit length of fibre.
- Mode field diameter: Controls the overlap between the guided optical mode and the doped core region; a tighter mode improves gain efficiency by concentrating intensity within the gain volume.
These parameters are not independent — increasing erbium concentration shortens the fibre length required for a given gain, but it also raises the risk of the efficiency-limiting mechanism that sets the practical upper bound on ion density.
Concentration quenching occurs when erbium ion density exceeds a threshold at which ion–ion interactions become significant. The dominant mechanisms are cooperative upconversion (one excited ion transfers energy to a neighbour, promoting it to a higher level while itself returning to ground state) and ion clustering (pairs or groups of ions in close proximity that rapidly cross-relax, effectively wasting absorbed pump energy).
The measurable consequence is a shortening of the ⁴I₁₃/₂ metastable level lifetime and an increase in non-saturable background loss — both of which reduce amplification efficiency. In pure silica glass, rare-earth solubility is inherently low, and erbium concentrations must be kept below approximately 5 × 10¹⁹ cm⁻³ to avoid severe quenching, as Lehigh University lecture material documents.
The practical implication is that gain per unit length and overall amplifier efficiency must be optimised together: simply increasing ion density to shorten the fibre will degrade performance beyond a well-defined concentration threshold.
With the material baseline established — the ions, their energy levels, the host glass that shapes their spectrum, and the fibre parameters that the designer controls — the amplification process itself can now be traced from its starting point: the moment pump light enters the fibre.
Step 1
Absorb the pump light into the erbium-doped fibre
Key Insights
WDM coupler joins pump and signal without loss
Both pump wavelengths deliver ions to ⁴I₁₃/₂
980 nm absorption band spans only ~8 nm
Power, wavelength stability, coupling set gain ceiling
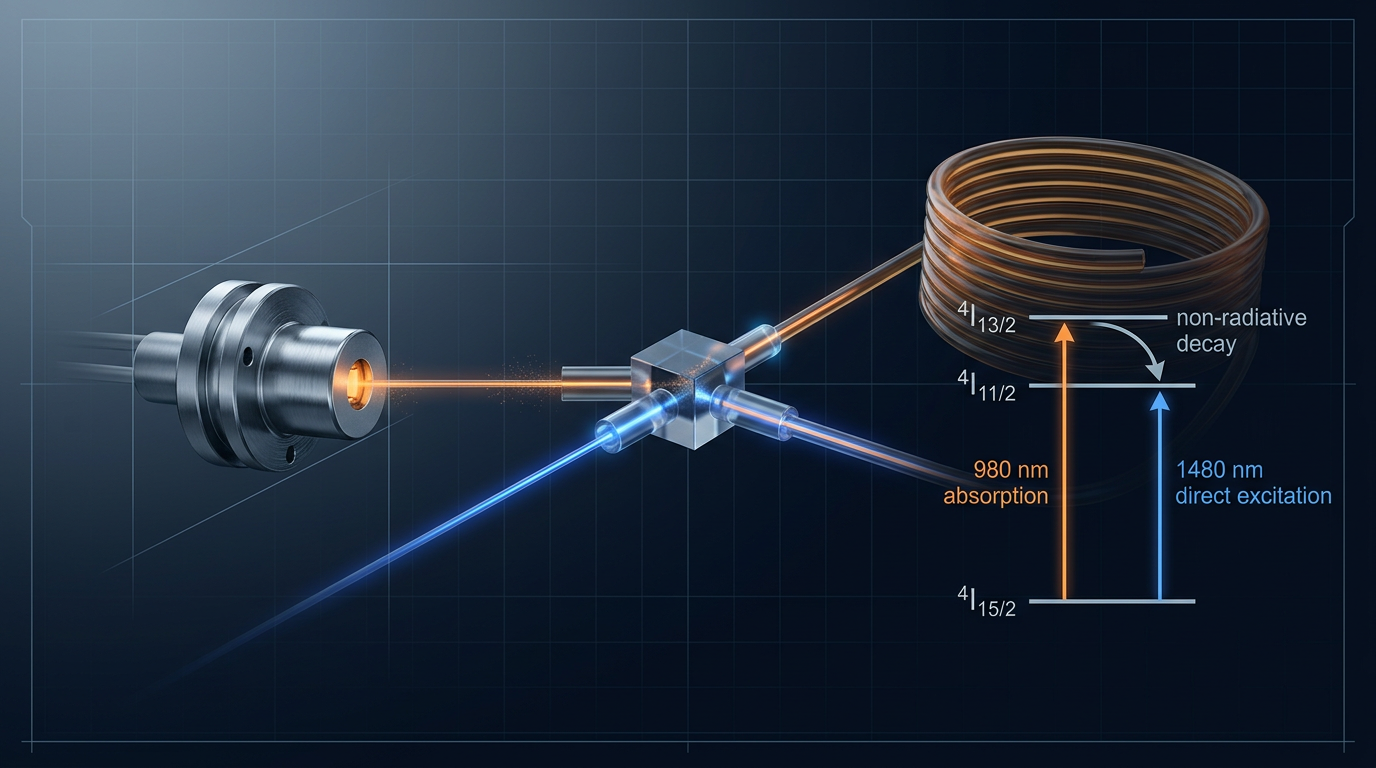
Pump light originates from a semiconductor laser diode and enters the erbium-doped fibre (EDF) via a wavelength-division multiplexing (WDM) coupler — a passive fibre component that combines two wavelengths into a single fibre path without introducing significant loss to either.
The WDM coupler is necessary because the pump and signal must share the same gain fibre: without it, injecting pump light would block or attenuate the signal path, defeating the purpose of the amplifier entirely.
Once inside the EDF, pump photons are absorbed by Er³⁺ ions and drive them out of the ground state. Two pump wavelengths are in common use, and each takes a distinct path through the ion's energy-level structure.
| Property | 980 nm pump | 1480 nm pump |
|---|---|---|
| Process type | Three-level | Quasi two-level |
| Absorption transition | ⁴I₁₅/₂ → ⁴I₁₁/₂ | ⁴I₁₅/₂ → upper manifold of ⁴I₁₃/₂ |
| Intermediate level | ⁴I₁₁/₂ (higher pump level) | None — bypasses ⁴I₁₁/₂ |
| Decay to metastable level | Non-radiative decay ⁴I₁₁/₂ → ⁴I₁₃/₂ (~1 µs) | Intra-band relaxation within ⁴I₁₃/₂ manifold |
| Energy released in transit | As heat (phonon emission) | As heat (intra-band thermalisation) |
| Final destination | Lowest sub-level of ⁴I₁₃/₂ | Lowest sub-level of ⁴I₁₃/₂ |
Comparing the two pump wavelength pathways side by side — energy-level route, process type, intermediate step, and decay timescale — communicates the structural differences more clearly than parallel prose paragraphs.
Despite following different routes, both pump wavelengths deliver ions to the same destination: the lowest sub-level of the metastable ⁴I₁₃/₂ level, which is the upper laser level from which stimulated emission will later occur.
The erbium absorption cross section in silica peaks near 980 nm, and the -3 dB absorption band spans only approximately 976–984 nm. A pump laser that drifts outside this narrow window excites fewer ions per milliwatt of pump power, directly degrading amplifier efficiency. This is why pump laser wavelength stability is a critical specification, not a secondary concern.
Three variables collectively set the ceiling on how many Er³⁺ ions can be excited: the pump laser output power, its wavelength stability (how closely it tracks the absorption peak), and the coupling efficiency into the gain fibre.
These three factors determine the upper limit on achievable population inversion — and therefore on achievable gain. How efficiently the absorbed pump power actually builds that inversion is the subject of Step 2.
Step 2
Build population inversion in the gain medium
Key Insights
Inversion required — below threshold, EDF absorbs signal
~10 ms ⁴I₁₃/₂ lifetime enables moderate-power inversion
980 nm achieves complete inversion; 1480 nm cannot
Higher inversion lowers n_sp and noise figure
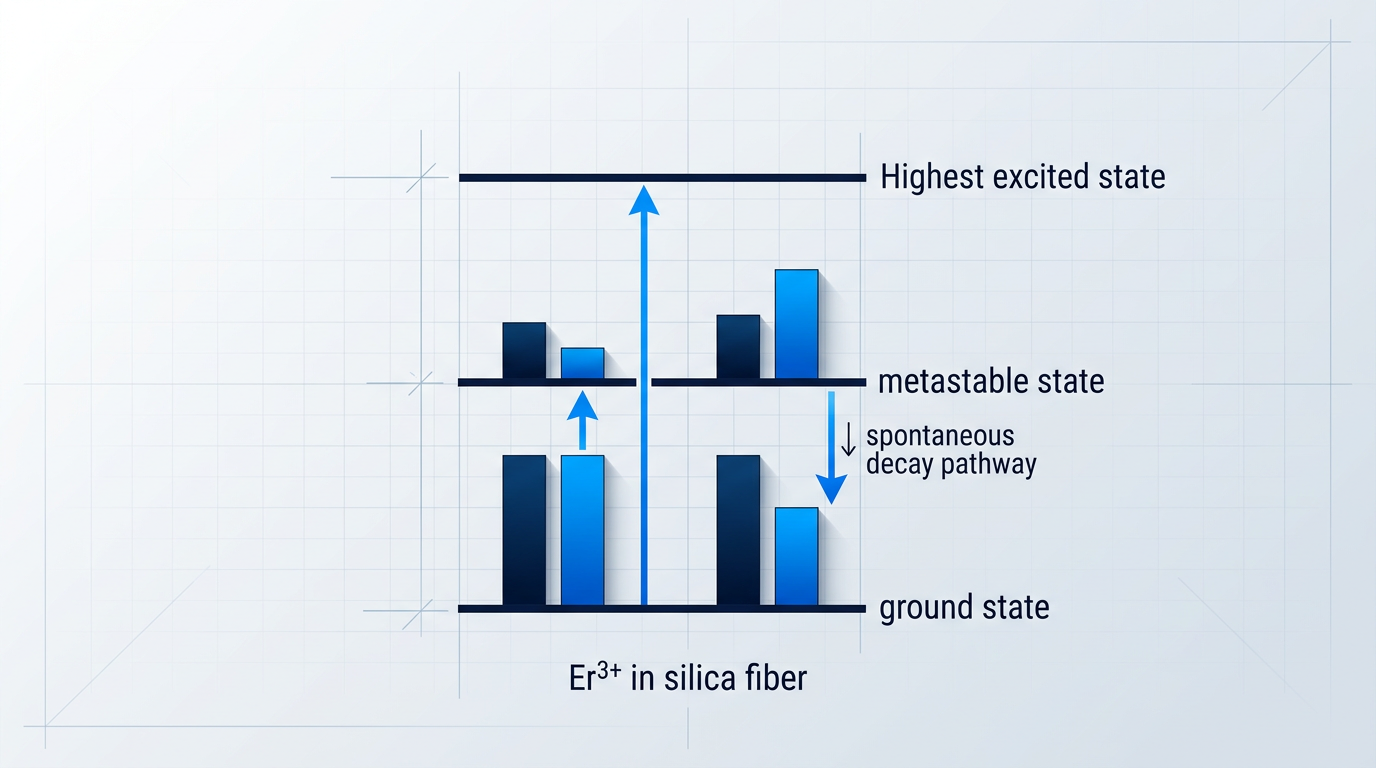
Pump absorption — covered in Step 1 — drives Er³⁺ ions out of the ground state, but that alone does not produce gain. Population inversion is the additional condition that must be met: more ions must occupy the metastable ⁴I₁₃/₂ upper laser level than the ground state ⁴I₁₅/₂.
Until that threshold is crossed, the erbium-doped fibre acts as a net absorber at signal wavelengths rather than an amplifier — stimulated emission cannot dominate absorption when the ground state holds the larger population.
The ~10 ms radiative lifetime of the ⁴I₁₃/₂ metastable level is the physical property that makes population inversion achievable at moderate pump powers. Ions accumulate in this level because spontaneous decay is slow relative to the pump rate — even pump powers of a few tens of milliwatts are sufficient to build a substantial inverted population. Without this long lifetime, ions would relax back to the ground state before inversion could be established.
The inversion level — the fraction of ions residing in ⁴I₁₃/₂ — is not a fixed quantity but a dynamic equilibrium determined by competing rates: pump drives ions upward, while stimulated emission and spontaneous decay drive them back down.
Increasing pump power raises the fraction of excited ions; at high pump power and low signal power, the system approaches its maximum achievable inversion for a given pump wavelength.
Fibre length and pump power: a coupled optimisation
Fibre length is the second engineering variable controlling inversion, and it cannot be chosen independently of pump power.
- Too short: Pump light exits the distal end unabsorbed — wasted power that could have inverted additional ions along a longer gain section.
- Too long: The pump is exhausted before the fibre end, leaving an uninverted tail that re-absorbs the signal it just amplified, eroding net gain.
- Optimum length: For WDM applications, the optimum is the length that maximises gain for the weakest signal channel — the length at which differential gain across channels reaches zero.
Because pump power sets how far along the fibre inversion is sustained, any change in pump power shifts the optimum length; the two variables must be iterated together during design.
980 nm vs 1480 nm: inversion quality contrast
The pump wavelength determines the quality of inversion achievable, not just its level, because of the Boltzmann factor β that appears in the steady-state rate equations.
| Parameter | 980 nm pump | 1480 nm pump |
|---|---|---|
| Transition pathway | Three-level: ⁴I₁₅/₂ → ⁴I₁₁/₂, then rapid (~1 µs) non-radiative decay to ⁴I₁₃/₂ | Quasi-two-level: direct excitation into upper manifold of ⁴I₁₃/₂ |
| Boltzmann factor β | ≈ 0 (energy gap ~0.4 eV makes thermal population negligible) | ≈ 0.4 (thermal population in lower sub-levels of ⁴I₁₃/₂ is non-negligible) |
| Maximum inversion factor n | Approaches 1 — essentially complete inversion | Limited to ~1.6 — incomplete inversion is a fundamental constraint |
| Minimum noise figure | < 4 dB | ~5.5 dB |
Directly comparing the two pump wavelengths across key inversion-quality dimensions — Boltzmann factor, maximum inversion factor, and resulting noise figure — communicates the contrast more clearly than prose alone.
With 980 nm pumping, the intermediate ⁴I₁₁/₂ level empties in ~1 µs via non-radiative decay, so ions accumulate cleanly in ⁴I₁₃/₂ with negligible thermal back-population of the lower sub-levels.
With 1480 nm pumping, the transition is quasi-two-level: the pump drives ions directly into the upper manifold of ⁴I₁₃/₂, but the non-negligible Boltzmann factor (β ≈ 0.4 in silica) means a thermal population always occupies the lower sub-levels — limiting maximum inversion to approximately n ≈ 1.6 regardless of pump power.
This is not a practical limitation that better engineering can remove; it is a fundamental consequence of the quasi-two-level energy structure at 1480 nm.
The practical consequence flows directly from the physics: the spontaneous emission factor n_sp equals N₂/(N₂ − N₁) and is minimised when inversion is maximised. Since noise figure scales as F_n ≈ 2n_sp, higher inversion from 980 nm pumping translates directly into a lower noise figure — the physical mechanism behind a result engineers often cite as a rule of thumb.
With the gain medium now inverted, the erbium-doped fibre is primed: an excited ion population exceeds the ground state, and the spontaneous emission factor is set by the pump wavelength choice. Step 3 addresses what happens when a signal photon arrives to trigger that stored energy.
Step 3
Trigger stimulated emission with the signal
Key Insights
One signal photon triggers a second identical photon
Gain is multiplicative — doublings compound along fibre
Phase coherence means modulated signals survive amplification intact
~10 ms lifetime prevents inter-channel cross-talk in DWDM
Gain peaks near 1530 nm — non-uniform across C-band
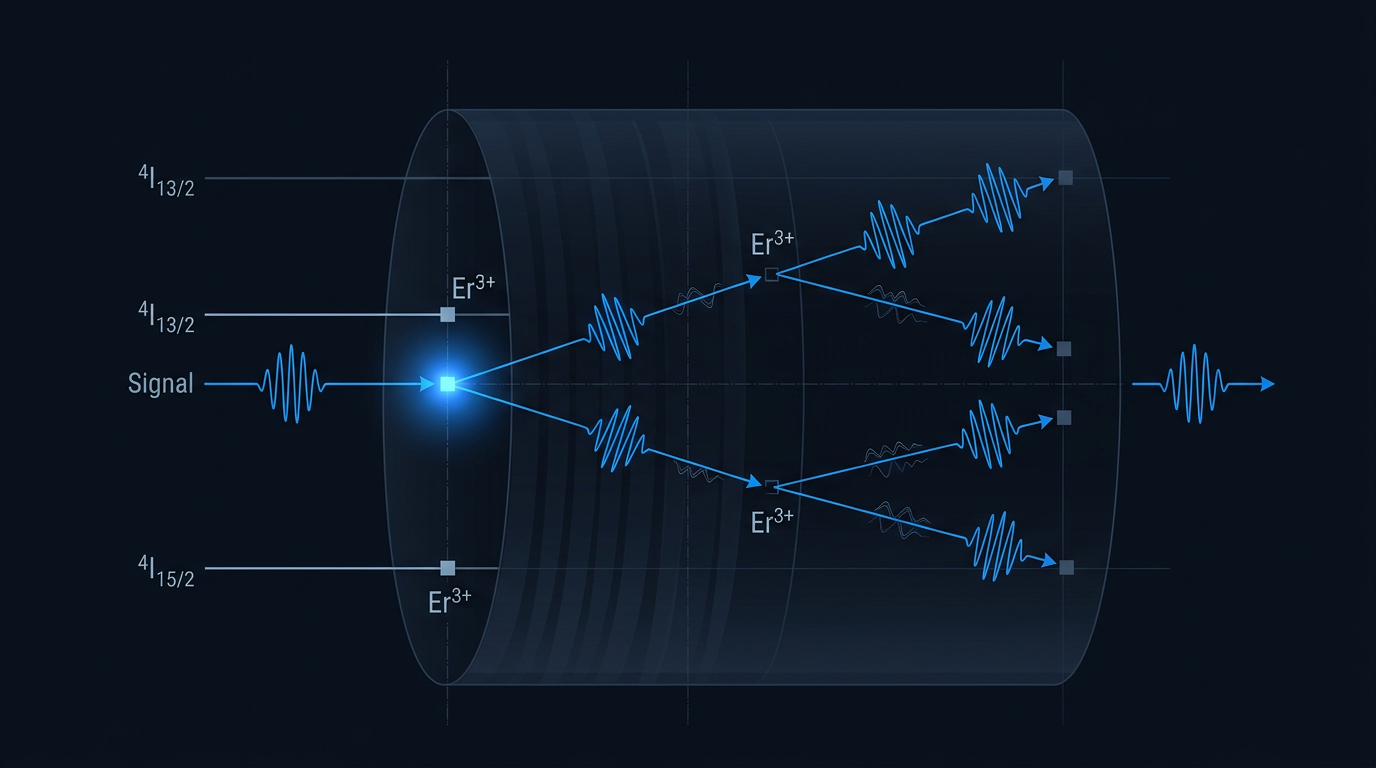
With population inversion established, the gain medium is primed. When a signal photon whose energy matches the ⁴I₁₃/₂ → ⁴I₁₅/₂ transition enters the erbium-doped fibre, it does not give up its own energy — it triggers an excited Er³⁺ ion to release its stored energy as a second photon.
That second photon is not an approximation of the first. The stimulated emission process produces a photon identical to the trigger in wavelength, phase, and direction of propagation — one photon enters the interaction, two leave.
- Wavelength: The emitted photon matches the signal wavelength exactly — no frequency shift.
- Phase: The emitted photon is phase-coherent with the triggering photon, preserving the signal's waveform.
- Direction: The emitted photon propagates in the same direction as the signal, contributing directly to forward gain.
Each of those two photons can now trigger further stimulated emission events in downstream excited ions. Two become four, four become eight — the process is multiplicative, not additive.
This compounding cascade is what produces gain along the fibre length. Even modest population inversion, sustained over sufficient fibre, accumulates into tens of dB of signal gain.
Because each stimulated photon is phase-coherent with its trigger, the amplified output is coherent with the input. EDFAs can therefore amplify signals carrying encoded information — amplitude, phase, or frequency modulation — without distorting that information.
The ~10 ms upper-state lifetime of the ⁴I₁₃/₂ level means the gain medium responds to signal power changes on a millisecond timescale. Data modulation and channel switching events occur far faster than the gain can follow, so a power fluctuation in one WDM channel cannot alter the gain seen by any co-propagating channel. All channels are amplified independently — a fundamental advantage for DWDM systems.
The probability that a signal photon triggers stimulated emission at a given wavelength is governed by the stimulated emission cross section of Er³⁺ in silica glass — and this cross section is wavelength-dependent.
In silica glass, the cross section peaks near 1530 nm and decreases toward longer wavelengths across the C-band and into the L-band. At low input powers, the gain difference between the 1530–1535 nm peak and the 1540–1560 nm plateau can exceed 10 dB.
This wavelength-dependent non-uniformity is the physical origin of the gain-flattening requirement addressed in Step 6.
It is worth noting that excited ions can also relax without a triggering photon — spontaneous emission — producing photons with random phase and direction. Those spontaneously emitted photons are the seed for ASE noise, covered in Step 5.
Step 4
Choose Your Pump Configuration
Key Insights
Forward pumping minimises noise figure — best for preamplifiers
Backward pumping maximises output power — best for boosters
Bidirectional: 980 nm forward + 1480 nm backward
Poor coupling efficiency caps gain regardless of configuration
The physics established in Steps 2 and 3 — that inversion level at the signal input end governs noise figure — now translates directly into a design decision: where along the erbium-doped fibre does the highest pump power land, and what does that do to performance?
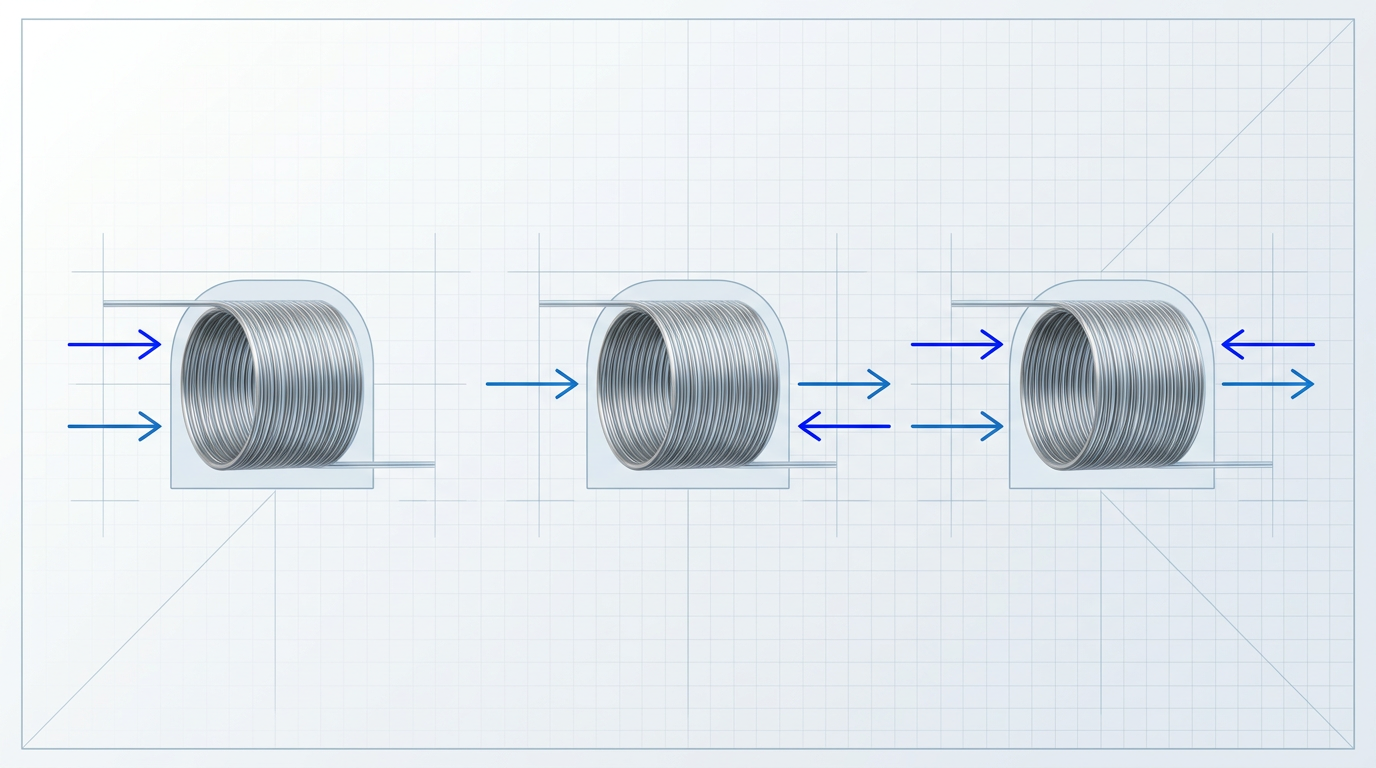
There are three configurations to choose from, each producing a distinct inversion profile along the fibre and therefore a distinct performance trade-off.
| Configuration | Pump Direction | Noise Figure | Output Power | Preferred Application |
|---|---|---|---|---|
| Co-propagating (forward) | Pump and signal enter from the same end | Low | Moderate | Preamplifier |
| Counter-propagating (backward) | Pump enters from the output end | Higher | High | Booster amplifier |
| Bidirectional | 980 nm forward + 1480 nm backward | Low | High | High-performance inline amplifier |
Comparing three pump configurations across multiple performance dimensions is information the reader needs to hold simultaneously — a table communicates this more efficiently than sequential prose.
With a co-propagating (forward) pump, the highest pump power is concentrated at the signal input end of the fibre — exactly where the signal is weakest.
This means the first few centimetres of the EDF operate at maximum inversion, minimising the spontaneous emission contribution before amplification begins and setting a low noise floor for the entire amplifier stage.
Forward pumping is therefore the configuration of choice for preamplifier stages, where the incoming signal is weak and noise figure is the primary constraint.
A counter-propagating (backward) pump enters the EDF from the output end, concentrating the highest pump power where the signal is already strong.
Because the signal travels most of the fibre's length before reaching this high-power region, gain saturation is delayed — the pump energy sustains amplification at higher signal powers rather than establishing inversion at a point that governs noise figure.
The trade-off is a higher noise figure: the signal input end operates at lower inversion, increasing the spontaneous emission contribution from the very first segment of the EDF.
Backward pumping is preferred for booster amplifier stages, where the signal entering the amplifier is already strong and output power is the primary requirement.
Forward pumping minimises noise figure — use it for preamplifiers. Backward pumping maximises output power — use it for boosters. When both matter, bidirectional pumping is the answer.
The bidirectional configuration pairs a 980 nm forward pump with a 1480 nm backward pump to exploit the strengths of both propagation directions simultaneously.
The 980 nm forward pump drives high population inversion at the signal input end (low noise figure); the 1480 nm backward pump delivers high power-conversion efficiency at the output end (high output power).
The result is an amplifier that achieves both low noise figure and high output power — at the cost of two pump laser sources and the greater system complexity that comes with them.
One practical constraint applies regardless of which configuration is chosen: coupling efficiency determines how much of the pump laser's output actually reaches the EDF.
Coupling efficiency depends on numerical aperture matching between the pump laser and the gain fibre, splice quality, and the pump delivery geometry — and poor coupling sets a hard ceiling on achievable gain that no configuration choice can overcome.
See These Design Principles in a Real EDFA
Pump configuration, noise figure, output power — every trade-off you have just worked through is built into our tailored EDFA solutions. Explore how these principles translate into configurable hardware.

Step 5
Manage amplified spontaneous emission (ASE)
Key Insights
ASE is spontaneous emission amplified like signal photons
In-band ASE sets a hard, unfilterable OSNR limit
Manage ASE via isolators, filters, and architecture
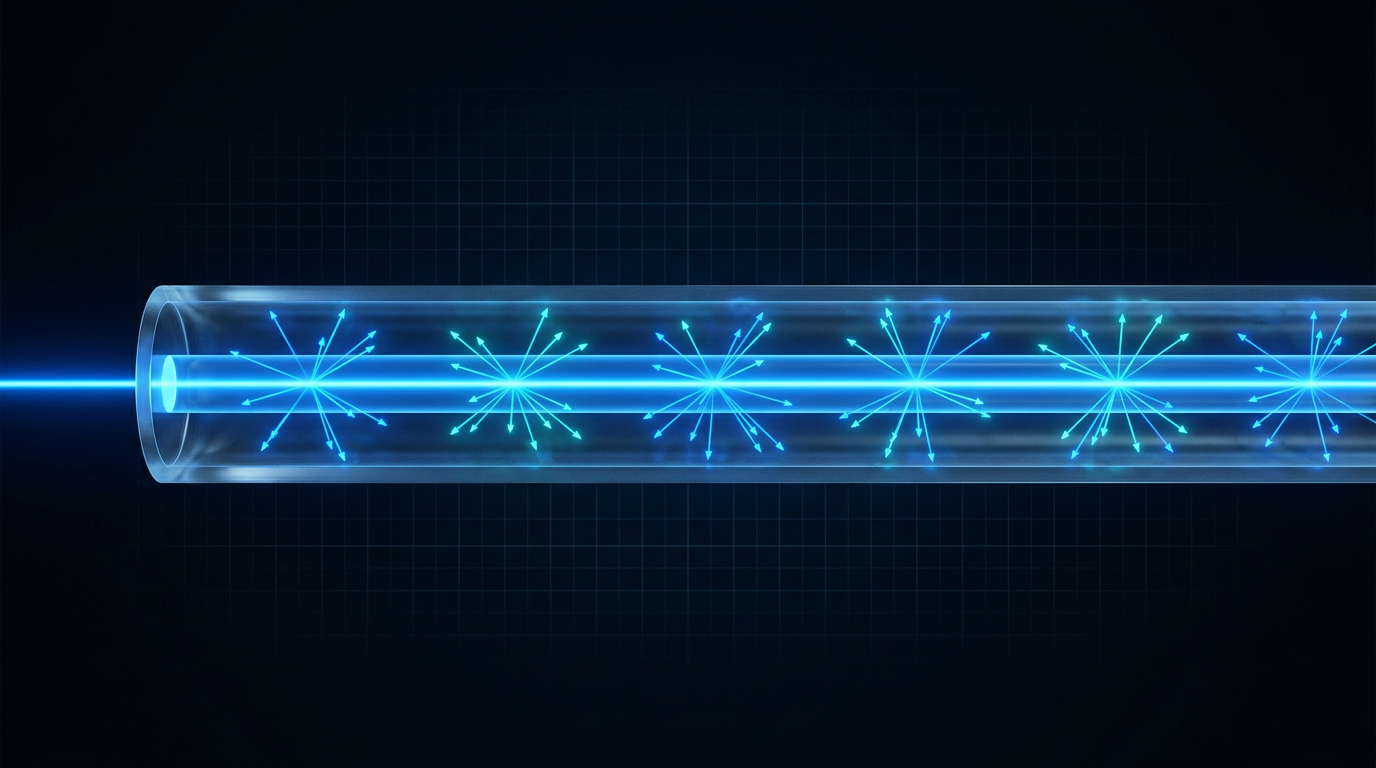
The same population inversion established in Step 2 that enables stimulated emission also drives a competing process: excited Er³⁺ ions can relax spontaneously, emitting photons with random phase and direction without any triggering signal photon. Those spontaneously emitted photons then propagate along the gain fibre and are amplified by the remaining inverted ions, producing amplified spontaneous emission (ASE) — broadband noise that spans the full gain window from 1530 to 1610 nm.
Because ASE occupies the same spectral window as the signal, it accumulates continuously along the fibre length and sets a fundamental ceiling on the optical signal-to-noise ratio (OSNR) at the amplifier output.
In-band ASE is spectrally indistinguishable from signal photons, so no amount of post-amplification filtering can remove it — the OSNR limit it imposes is a design constraint to be minimised at the source, not corrected downstream.
Isolators: two placements, two distinct functions
Optical isolators are passive components that transmit light in one direction only, and their placement within an EDFA serves two separate purposes that should not be conflated.
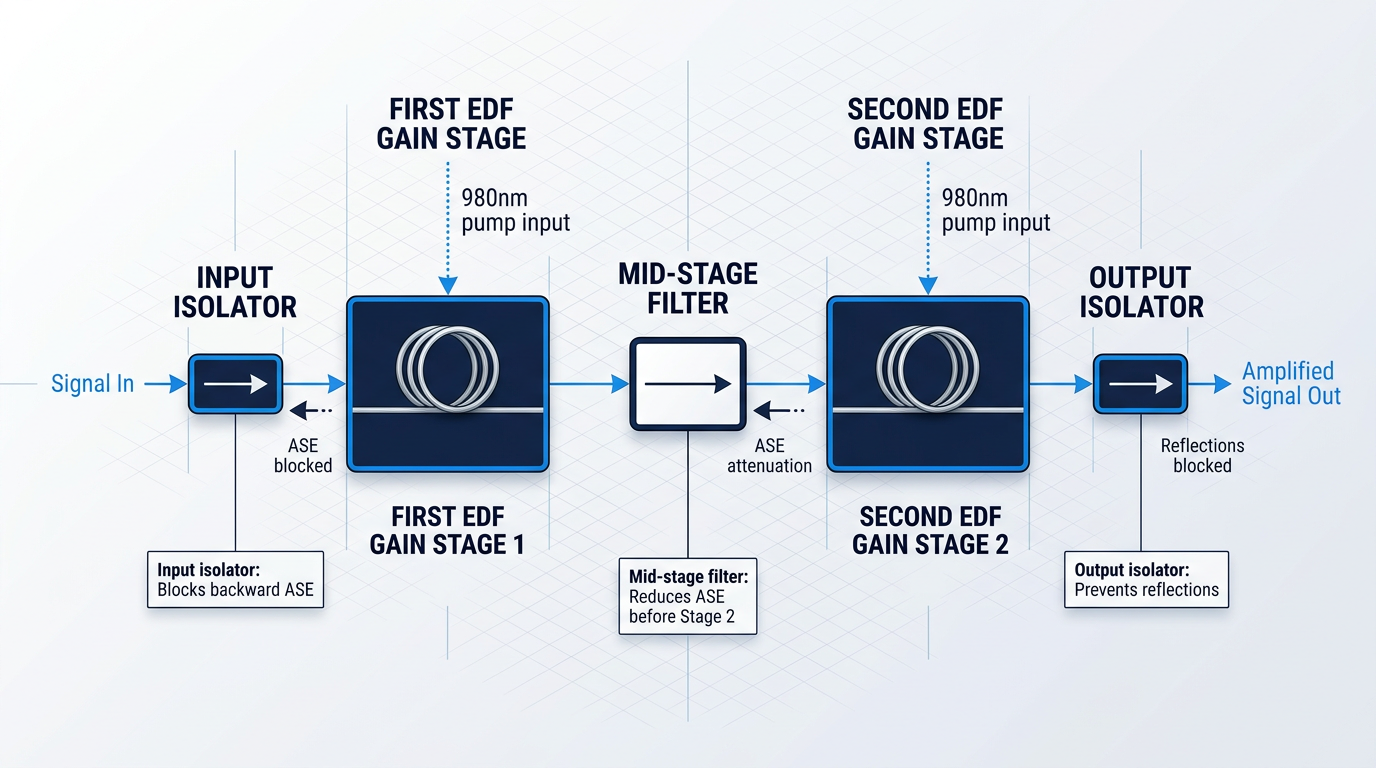
- Input isolator: Blocks backward-propagating ASE from re-entering the gain stages. Without it, backward ASE saturates the population inversion, reducing available gain and degrading noise figure.
- Output isolator: Prevents reflections from downstream network components from re-entering the amplifier and establishing an uncontrolled feedback loop — effectively turning the EDFA into an unintended laser.
ASE filters, placed after the gain fibre, suppress out-of-band noise power in spectral regions the signal does not occupy, improving output OSNR for the channels that matter.
Their limitation is the same one that applies to all post-generation filtering: they cannot touch in-band ASE, which is why architectural choices that reduce ASE generation are more consequential than any filter placed after it.
In a two-stage amplifier, inserting an interstitial filter between the two gain stages — rather than at the input or output — attenuates backward-propagating ASE before it can saturate the first stage, raising the net inversion level there and improving both gain and noise figure. This mid-stage placement also sets up the gain-flattening function covered in Step 6.
The amount of ASE a given amplifier generates is determined by pump power, fibre length, inversion level, and architecture — and these variables are coupled, not independent.
Pump power, fibre length, inversion level, and amplifier architecture jointly determine how much ASE an EDFA produces. Treating them as coupled variables from the outset — rather than reaching for filters after the fact — is what separates a well-engineered amplifier from one that merely works.
Step 6
Flatten the gain spectrum for WDM operation
Key Insights
Place GFF mid-stage, not at amplifier output
Gain imbalance accumulates across cascaded amplifier spans
GFF flatness only holds at its design point
C+L systems need separate parallel gain sections
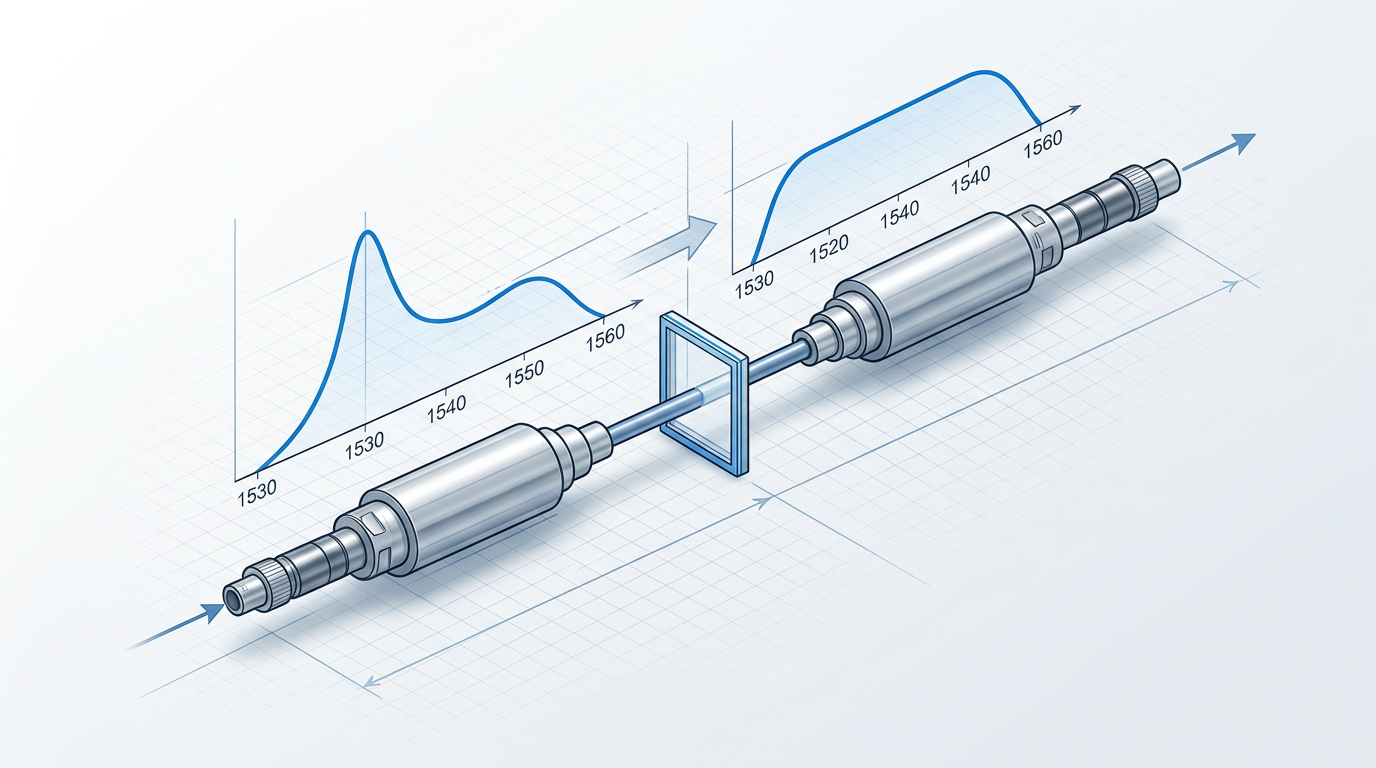
As established in Step 3, the stimulated emission cross section of Er³⁺ in silica is wavelength-dependent, peaking near 1530–1532 nm and falling off toward longer wavelengths across the C-band.
The practical consequence is that channels sitting near the gain peak receive substantially more amplification than channels in the flatter plateau region around 1540–1560 nm — the difference can exceed 10 dB between peak and plateau.
In a single-channel system this imbalance is manageable, but in a DWDM system carrying tens or hundreds of simultaneous channels, it creates a serious engineering problem.
Each amplifier stage adds its own gain tilt to the signal ensemble, so the imbalance accumulates with every span in the cascade — a modest per-amplifier differential compounds into a severe channel-power disparity across a long-haul link.
Channels near the gain peak eventually saturate or clip, while channels in the lower-gain region fall toward the noise floor, degrading system reach and capacity.
Using a gain-flattening filter to equalise the band
A gain-flattening filter (GFF) is a wavelength-selective loss element inserted into the amplifier path to attenuate the higher-gain channels, bringing signal powers across the band into balance.
The two dominant implementation technologies are thin-film filters and fibre Bragg gratings — both are passive components that impose a spectrally shaped loss profile matched to the inverse of the amplifier's gain ripple.
It is important to understand that a GFF works by introducing loss, not by adding gain to weaker channels, so there is always a power cost associated with flattening.
In a two-stage amplifier, insert the GFF between the two gain stages. Input placement degrades noise figure because loss before the first stage raises the effective NF. Output placement wastes the pump power invested in the final amplified signal. Mid-stage placement lets the second stage recover the GFF's insertion loss, and it also attenuates backward-propagating ASE — improving inversion in the first stage, as covered in Step 5.
This mid-stage placement rule is the single most important design decision when incorporating a GFF into a multi-stage EDFA.
A GFF is designed to flatten the gain spectrum at a specific operating point — a defined input power level and channel loading.
When the average inversion in the erbium-doped fibre shifts (for example, as channel count changes or input power varies), the gain spectrum tilts and the GFF's correction becomes imperfect.
Systems with variable channel loading may therefore require dynamic gain equalisation (DGE) rather than a fixed GFF — DGE adjusts its loss profile in real time to track the changing gain shape, but that architecture is a topic in its own right.
Wideband operation: C+L band architecture
When a system must span both the C-band (~1530–1562 nm) and the L-band (~1570–1605 nm), a single gain stage cannot efficiently serve both bands simultaneously.
L-band operation requires a higher average inversion level than C-band to achieve comparable gain at its longer wavelengths, and the two bands interact in ways that prevent joint optimisation within a single fibre section.
The solution is a band-splitting architecture: a band-splitting filter divides the incoming signal into two separate paths, each routed to an independent parallel gain section — one optimised for C-band, the other for L-band — before the outputs are recombined.
This separation allows each gain section to be independently pumped and gain-flattened for its own band, which is the only practical route to achieving flat, high-quality amplification across the full C+L window.
Step 7
Select Your Pump Wavelength for the Application
Key Insights
980 nm pump achieves lowest noise figure
1480 nm pump delivers higher output power
960 nm pump suits L-band EDFAs
Right wavelength is application-driven, not universal
The pump wavelength thread running through Steps 1, 2, and 4 converges here into a practical decision: for your specific application, which pump wavelength — or combination — gives the best result across noise figure, output power, conversion efficiency, and thermal load?
There is no universal answer. The right choice is determined by what the amplifier is being asked to do.
| Parameter | 980 nm pump | 1480 nm pump |
|---|---|---|
| Minimum noise figure | Substantially lower — near-complete inversion reduces spontaneous emission factor | Higher minimum — partial inversion sets a harder floor |
| Population inversion | Near-complete under strong pumping | Partial — quasi two-level limit applies |
| Optical-to-optical conversion efficiency | Lower — larger photon energy gap to signal | Higher — photon energy closer to signal |
| Output power per pump laser | Moderate | Higher |
| Wall-plug efficiency | Superior — lower electrical power per dB gain | Lower |
| Preferred application | Preamplifiers, long-haul cascaded chains | Booster amplifiers, high output power |
A direct side-by-side comparison across the key performance axes makes the trade-off immediately legible — prose alone would require the reader to hold multiple variables in mind simultaneously.
The efficiency gap between the two wavelengths is grounded in photon energetics. A 980 nm pump photon carries meaningfully more energy than a 1480 nm pump photon, which in turn sits much closer to the signal photon energy at 1550 nm.
The energy difference between the pump and signal photon is dissipated as heat in the gain medium, so 980 nm pumping carries a significant conversion efficiency penalty relative to 1480 nm pumping for the same amplification task — a penalty that is intrinsic to the physics, not an artefact of component quality.
That penalty is the direct price of the noise-figure advantage: the higher photon energy drives stronger population inversion, which reduces the spontaneous emission factor and pushes the noise figure well below what 1480 nm pumping can achieve.
For L-band EDFAs, neither 980 nm nor 1480 nm is the straightforward choice — a third option, 960 nm pumping, is specifically suited to this band.
L-band EDF uses higher erbium concentration to extend gain into the 1565–1625 nm window. Because the erbium absorption cross section peaks near 980 nm, a 980 nm pump is absorbed heavily within the first few metres of fibre, concentrating population inversion near the pump entry point and generating excessive ASE there rather than building the uniform inversion the L-band gain profile requires.
A 960 nm pump is absorbed less strongly, so it penetrates deeper into the fibre and distributes inversion more evenly along the gain medium — yielding meaningfully more amplified signal power at the output compared with 980 nm pumping in the same L-band configuration.
Choosing 980 nm, 1480 nm, or 960 nm is not independent of pump direction or fibre length. The noise figure, output power, and thermal behaviour you achieve depend on all three together — selecting a pump wavelength from a datasheet without fixing the other parameters first will not give you the result you expect.
Mapping application requirement to pump wavelength gives a practical starting point for the design:
- Preamplifier in a long-haul DWDM chain: Noise figure is the priority. Use a 980 nm forward pump — near-complete inversion combined with co-propagating geometry delivers the lowest achievable noise figure, limiting accumulation across cascaded spans.
- Booster amplifier: Output power is the priority. Use a 1480 nm counter-pump or a hybrid 980 nm forward / 1480 nm backward configuration — 1480 nm's higher conversion efficiency and output power per pump laser are the dominant advantages here.
- High-power application with thermal constraints: 980 nm's superior wall-plug efficiency means less electrical power consumed per dB of gain, reducing thermal load on the gain medium and the cooling system — a meaningful advantage when average power is high.
- L-band amplification: Use a 960 nm pump. It avoids the concentrated near-input inversion problem of 980 nm pumping, distributes inversion uniformly along the L-band EDF, and delivers better output power in this band.
For demanding or non-standard applications — high average power, pulsed regimes, dual C+L band, or specific integration constraints — the pump wavelength is one of several parameters that must be engineered together rather than selected independently.
This is where our Custom EDFA delivers its advantage. Operating band (C, L, or dual C+L), output power, pulse regime, cooling (air or water), and pump configuration are all engineered as a system from the outset — not assembled from fixed catalogue options. For applications requiring pulse energies above 10 mJ, peak powers above 100 kW, or average powers above 100 W, this end-to-end approach is the appropriate path to a result that holds across the full operating envelope.
See the Physics Applied to a Real EDFA
The EDF-UL-10 is built for free-space optical communications, delivering high average output power with on-demand modulation. Download the datasheet to see how pump design choices translate into hardware specifications.

Conclusion
From understanding to design: where to go next
You can now trace EDFA performance as a chain of cause and effect — each design choice shapes the next, and the interactions between them determine what the amplifier actually delivers.
That reasoning capability is what turns pump wavelength, fibre length, erbium concentration, pump geometry, and gain management from independent knobs into a coherent design space.
The natural next questions are architectural and application-specific: which topology fits your system, how your application weights noise figure against output power, and whether a catalogue solution covers your requirements or the parameters need engineering from scratch.
Frequently asked questions about erbium-doped fibre amplifiers
Common questions about EDFA operating principles, gain, noise figure, fibre length, and telecommunications applications — answered directly.
Erbium-doped fibre is silica optical fibre with trivalent erbium ions (Er³⁺) incorporated into the core, serving as the gain medium in EDFAs. The ⁴I₁₃/₂ → ⁴I₁₅/₂ energy-level transition produces optical gain across the 1530–1625 nm window — which coincides precisely with silica fibre's minimum-loss transmission region. That alignment is what makes erbium-doped fibre the foundation of modern long-haul optical communications.
Small-signal gain in an EDFA typically ranges from 20 dB to more than 40 dB, depending on pump power, fibre length, erbium concentration, and signal input power. At higher input powers, gain compresses as the amplifier saturates — a well-understood trade-off between gain and output power. Practical saturation output powers make EDFAs suitable for both preamplifier roles (where low noise figure matters most) and booster roles (where high output power is the priority).
EDFAs offer a combination of benefits that no other amplifier technology matches across the same operating window: amplification entirely in the optical domain (no optical-to-electrical conversion); broad gain bandwidth supporting simultaneous amplification of many WDM channels; a practically achievable noise figure of 4–6 dB; and polarisation-insensitive gain. The gain window at 1530–1625 nm aligns with silica fibre's minimum-loss region, minimising system loss. The operating wavelength around 1550 nm is also eye-safer than shorter-wavelength alternatives such as 1064 nm, which is relevant for LiDAR and free-space optical communications applications.
Yes. EDFAs became the backbone of long-haul fibre communications from the 1990s onwards, and remain central to the infrastructure today. The gain window spans the C-band (1530–1565 nm) and L-band (1565–1625 nm) used in DWDM systems, allowing a single EDFA to amplify dozens of channels simultaneously without optical-to-electrical conversion. The long ⁴I₁₃/₂ metastable-level lifetime of approximately 10 ms is also critical: it prevents population inversion from responding to fast intensity fluctuations between channels, which suppresses inter-channel crosstalk in dense WDM systems.
The quantum-limited minimum noise figure for a phase-insensitive optical amplifier is 3 dB. In practice, well-designed EDFAs achieve noise figures in the range of 4–6 dB. Pump wavelength is the primary design lever: 980 nm pumping drives near-complete population inversion and can achieve noise figures below 4 dB, approaching the quantum limit more closely. 1480 nm pumping operates on a quasi two-level transition with a non-negligible Boltzmann factor, limiting the achievable inversion and typically yielding noise figures around 5.5 dB. Beyond pump wavelength, noise figure is also affected by isolator placement, the degree of population inversion at the signal input end of the fibre, and whether a single-stage or two-stage amplifier architecture is used.
There is an optimum fibre length for any given pump power and erbium concentration, and deviating in either direction degrades performance. Too short a fibre leaves pump light unabsorbed, wasting pump power and limiting gain. Too long a fibre means the distal section — where pump power is depleted — operates below the inversion threshold and re-absorbs signal photons rather than amplifying them, reducing net gain. For WDM systems, the practical optimum is the length that minimises differential gain across channels, not simply the length that maximises peak gain. L-band EDFAs require longer fibre than C-band designs because the emission cross section is lower at longer wavelengths, demanding more interaction length to achieve comparable gain.