

Introduction
This guide is written for engineers, photonics researchers, and technical buyers who need more than a working definition of EDFA — people who are specifying, designing around, or evaluating amplifier technology and need a reference they can rely on.
It moves deliberately: from the underlying physics and core components, through amplifier types and the performance parameters that govern real system behaviour, to the practical deployment and integration considerations that most technical references leave largely untouched.
The basics are not over-explained here, and the specifics are not softened.
By the end, you should have a complete, grounded understanding of EDFA technology — from first principles through to real-world system integration.
TL;DR
EDFA's dominance in optical communications is not accidental. It follows from a specific combination of physics, wavelength compatibility, and system-level properties that no competing technology fully replicates — and understanding exactly why reveals as much about optical system design as it does about the amplifier itself.
This article covers:

The physics of optical amplification
Core components and their roles in amplifier performance
EDFA types: booster, in-line, and pre-amplifier
Gain, noise figure, output power, and gain flatness
EDFA vs. Raman and SOA amplifiers
Practical deployment and integration considerations
What is an EDFA?
Few components have shaped modern optical communications as decisively as the erbium-doped fiber amplifier — a device that amplifies light directly in the optical domain, without ever converting it to an electrical signal, across the wavelength range that silica fibre happens to transmit best.
Definition and Operating Wavelength Range
An EDFA (erbium-doped fiber amplifier) is an optical amplifier that uses a short length of silica optical fibre doped with trivalent erbium ions (Er³⁺) as its gain medium.
The device amplifies optical signals entirely within the optical domain — no photodetection, no electronic processing, no retransmission — by exploiting stimulated emission in the erbium ions when the fibre is pumped with a suitable laser source.
EDFAs provide gain across two primary telecom bands: the C-band (1530–1565 nm) and the L-band (1565–1625 nm), giving a combined operating window of 1530–1625 nm.
Why the 1550 nm Window Matters
The significance of this wavelength range is not a design choice — it is a physical fact about silica glass.
Standard single-mode silica fibre achieves its lowest attenuation near 1550 nm, with typical values of approximately 0.20 dB/km and ultra-low-loss variants reaching below 0.15 dB/km.
At this attenuation level, signals can travel far greater distances before requiring amplification than at any other commercially practical wavelength, which is why the entire long-haul fibre-optic industry converged on this window.
Erbium's Er³⁺ ion has an energy transition near 1530 nm — a coincidence of atomic physics that places its gain window almost exactly over silica's loss minimum.
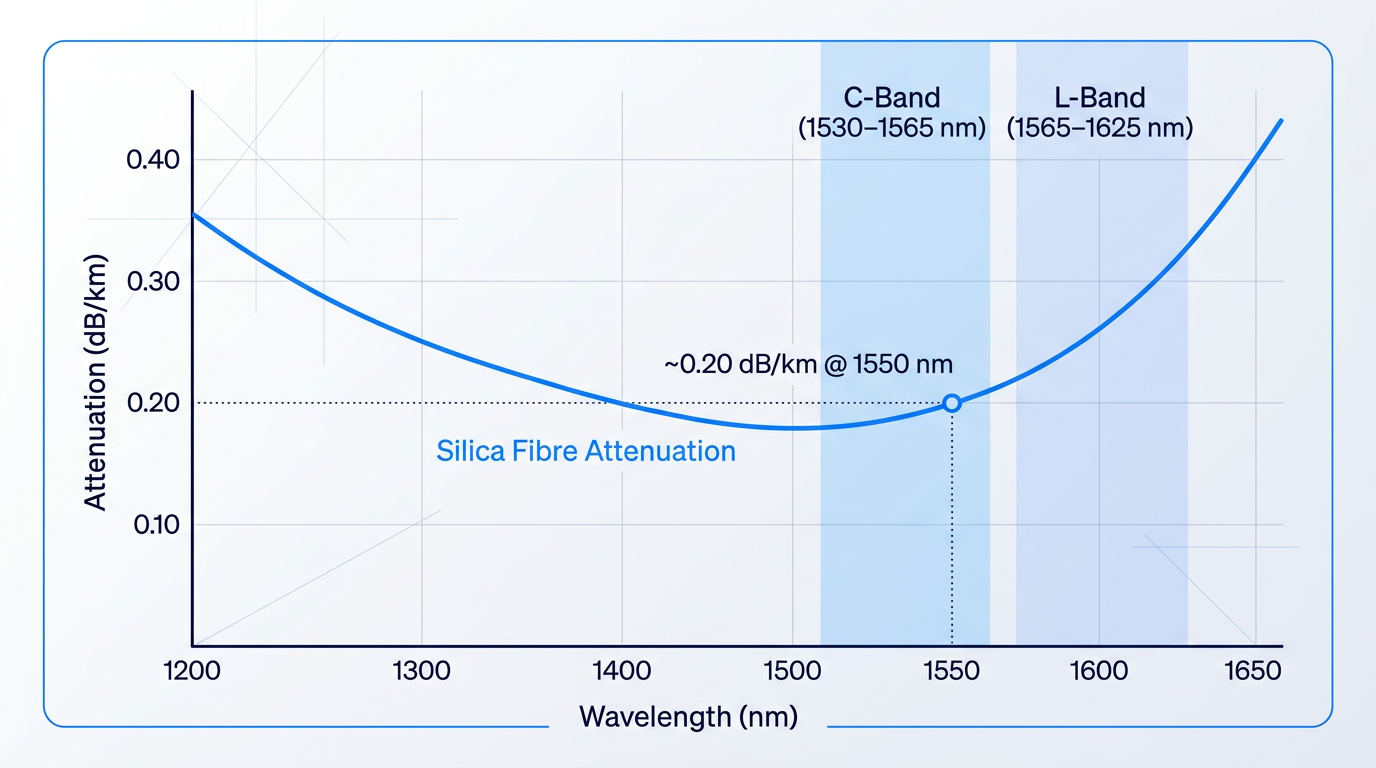
This physical alignment — erbium's natural gain window coinciding with silica fibre's loss minimum — is not engineered but is the reason EDFA became the technology of choice for long-haul optical communications.
Erbium's gain window (1530–1625 nm) coincides almost exactly with silica fibre's loss minimum near 1550 nm. This is a property of atomic physics and glass chemistry, not deliberate design — and it is the single most important reason EDFA became the dominant optical amplification technology.
Historical Context: Invention and Commercial Deployment
In 1985, Robert Mears — then a graduate student — published the paper that first demonstrated optical gain in an erbium-doped optical fibre amplifier, reporting 30 dB of optical amplification at the 1.5-micrometre telecommunications wavelength with practical pump laser powers in the milliwatt range.
The invention is described in UK Patent Applications filed 13 August 1985, with co-inventors L. Reekie, S.B. Poole, and D.N. Payne — a collaboration that produced the foundational papers in Electronics Letters through 1986 and 1987.
Commercial deployment followed in the early 1990s, with EDFA-equipped submarine cables entering service and displacing the optoelectronic repeater systems that had defined long-haul transmission up to that point.
Displacing Electronic Regeneration
Before the EDFA, long-haul optical links depended on optoelectronic repeaters: devices that detected the optical signal, converted it to electrical form, regenerated it electronically, and retransmitted it optically — placed every few tens of kilometres along the route.
These repeaters were expensive, mechanically complex, and fundamentally limited: each had to be designed for a specific data rate and modulation format, making upgrades costly and bandwidth expansion difficult.
The EDFA replaced this architecture with all-optical amplification — the signal never leaves the optical domain, the amplifier is transparent to data rate and modulation format, and a single device simultaneously amplifies every wavelength channel passing through it.
This is not merely a cost reduction: it is a qualitative shift in what long-haul optical systems can do, because wavelength-division multiplexed (WDM) channels can be added or upgraded without replacing the amplifiers along the route.
The Scale of the Transformation
Prior to the EDFA, transatlantic telecommunications cables operated at 140 Mbit/s and required submarine electronic repeaters every few tens of kilometres.
By keeping signals optical and allowing multiple wavelength carriers to be simultaneously amplified, the EDFA increased transoceanic transmission capacity by more than three orders of magnitude, enabling the intercontinental fibre links that underpin the modern internet.
As Mears stated, the EDFA "transformed optical-fiber transmission, enabling the broadband Internet" — a characterisation that the historical record of submarine cable deployment bears out.
Three Roles in an Optical Link
In a deployed optical transmission system, an EDFA serves one of three functional roles depending on its position: as a power booster (post-amplifier) immediately after the transmitter, as an in-line amplifier compensating for span loss along the route, or as a pre-amplifier conditioning the signal before the receiver.
Each role carries different requirements for gain, noise, and output power — the distinctions are covered in full later in this guide.
To understand why erbium-doped fibre amplifies so effectively at these wavelengths, it helps to examine the underlying physics: the energy level transitions in Er³⁺ ions, population inversion, and how pump light drives the amplification process.
How an EDFA Works: The Physics of Optical Amplification
The behaviour of an EDFA in a real system — its noise floor, its gain bandwidth, its suitability for a given application — is determined entirely by the physics happening inside a few metres of doped fibre. Understanding that physics is not an academic exercise; it is the foundation for every design decision that follows.
The core mechanism is stimulated emission. When a signal photon at the right wavelength encounters an erbium ion already in an excited state, it triggers that ion to release a second photon — identical in wavelength, phase, and direction to the first. The signal is not merely passed through; it is coherently copied, photon by photon, as it propagates along the fibre. This is what distinguishes an EDFA from any passive optical component: it adds energy to the signal rather than simply routing it.
Energy Levels and the Metastable State
Three energy levels in the Er³⁺ ion govern EDFA operation. Ions at rest occupy the ground state (⁴I₁₅/₂). When pumped at 980 nm, they absorb a pump photon and jump to the short-lived excited state (⁴I₁₁/₂), where they remain for only about 1 µs before decaying non-radiatively — releasing energy as phonons rather than photons — into the metastable state (⁴I₁₃/₂). It is from this metastable level that stimulated emission occurs, returning ions to the ground state and releasing signal photons in the 1530–1565 nm range.
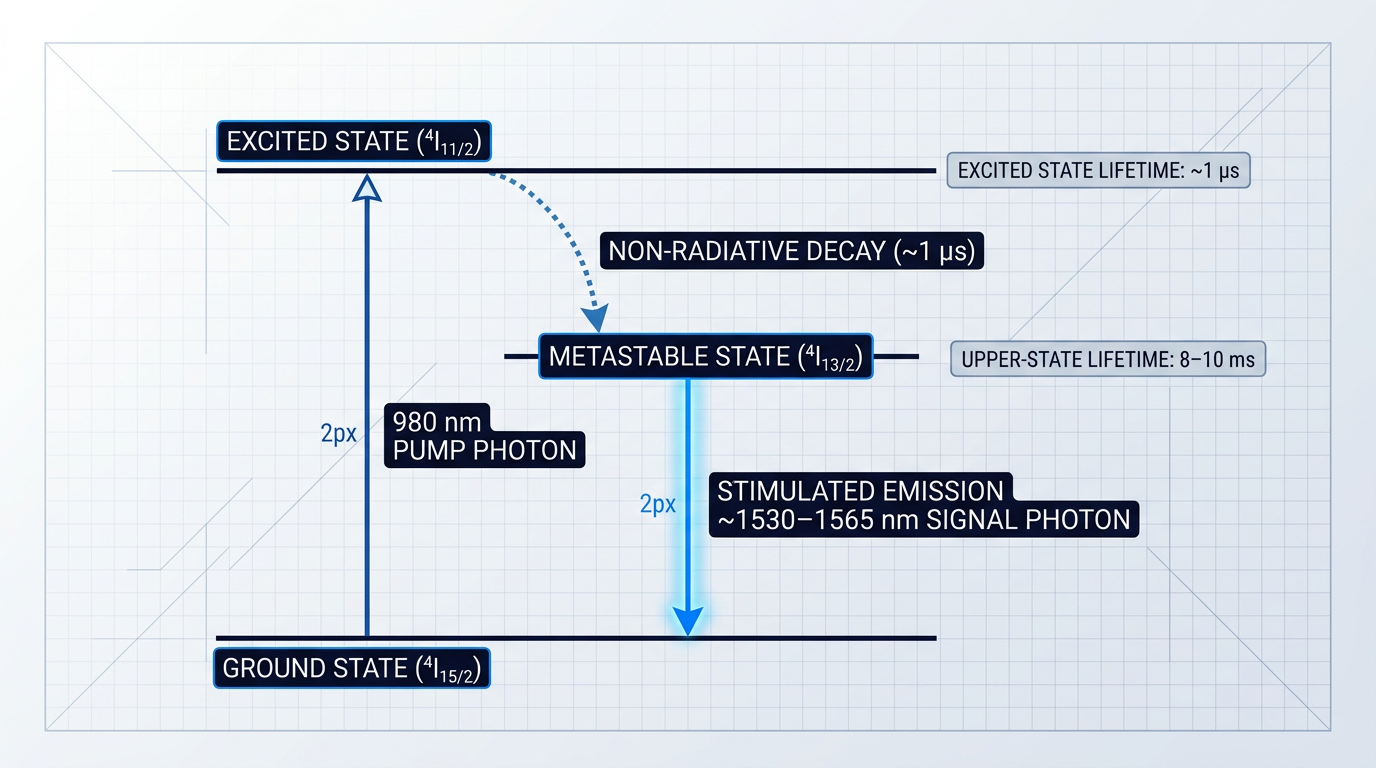
What makes the metastable state so significant is its upper-state lifetime of approximately 8–10 ms — roughly four orders of magnitude longer than the excited state above it. This is not simply a curiosity of erbium's atomic structure; it is the property that makes the EDFA commercially viable for modern optical networks.
Because the gain medium responds on a millisecond timescale, it cannot follow the modulation of individual data bits, which operate at nanosecond-to-picosecond timescales. The result is bit-rate transparency: the EDFA amplifies all channels simultaneously, with its gain entirely unresponsive to the data pattern carried by any individual channel. A single amplifier works equally for 10G, 100G, or 400G traffic without modification — and crucially, the gain seen by one WDM channel is not disturbed by power fluctuations on another.
The ~10 ms lifetime of the Er³⁺ metastable state (4I13/2) means EDFA gain cannot respond to individual data bits, suppressing inter-channel crosstalk and enabling simultaneous amplification of all WDM channels without format or bit-rate constraints.
Population Inversion and the Pump Laser
Population inversion is the prerequisite for net amplification: there must be more ions in the metastable state than in the ground state for stimulated emission to dominate over absorption. Without continuous pumping, the erbium-doped fibre simply absorbs the signal — the medium is lossy, not gainful.
The pump laser is the energy source that drives and sustains this inversion. Two pump wavelengths are used in practice, each with a distinct excitation pathway and a different set of engineering trade-offs.
- 980 nm pumping: Excites ions to the ⁴I₁₁/₂ state, which decays rapidly to the metastable level. Delivers high gain efficiency and a lower noise figure, making it the preferred choice where signal quality is the priority.
- 1480 nm pumping: Excites ions directly to the upper edge of the ⁴I₁₃/₂ metastable band. Achieves higher optical power conversion efficiency but produces a higher noise figure than 980 nm pumping.
The noise figure difference between the two pump wavelengths has a clear physical cause. At 980 nm, the pump absorption band does not overlap with the signal band, so the pump cannot directly stimulate emission or generate amplified spontaneous emission (ASE) — the background noise produced when spontaneously emitted photons are themselves amplified along the fibre. At 1480 nm, the pump wavelength falls within the metastable band and partially overlaps the signal region, meaning the pump light can itself stimulate emission and seed additional ASE, raising the noise floor.
In practice, 1480 nm pumping offers a power conversion efficiency advantage — optical-to-optical conversion efficiencies approaching 80% have been demonstrated, compared to around 50% for 980 nm — because the smaller quantum defect between pump and signal photon energies means less energy is lost as heat. This makes 1480 nm pumping attractive for high-output-power applications where the noise figure is less critical. Where noise performance is paramount, 980 nm pumping is the standard choice.
Quasi-Three-Level Behaviour and the Transparency Threshold
Erbium in silica glass operates as a quasi-three-level system, not the idealised four-level laser that introductory texts often describe. In a four-level system, the lower laser level is well above the ground state and remains essentially unpopulated — the medium is transparent to the signal wavelength even without pumping. Erbium's lower laser level is the ground state manifold, so at rest the medium absorbs at the signal wavelength rather than transmitting it.
This creates a practical engineering constraint: a transparency threshold must be crossed before any net gain is achievable. At wavelengths around 1535 nm, more than 50% of the erbium ions must be in the excited state before stimulated emission begins to outpace ground-state absorption. Below that excitation level, the fibre attenuates the signal. There is therefore a minimum pump power below which the amplifier is a net absorber — a constraint that directly influences pump laser specifications and operating margins.
The quasi-three-level nature also means that the spectral shape of the gain depends on the degree of excitation: at lower pump powers, gain is positive only at longer wavelengths where reabsorption is weaker, while higher excitation levels progressively extend the gain to shorter wavelengths within the C-band. This excitation-dependent gain profile is one of the reasons the erbium gain spectrum is non-uniform across the amplification window — a point that becomes important when considering multi-channel WDM performance.
With the amplification mechanism established — stimulated emission driven by a pump laser, mediated by population inversion, shaped by quasi-three-level physics — the next step is to examine the physical components that implement it. Each one exists to satisfy a specific requirement the physics imposes, and understanding that connection makes the component architecture considerably easier to reason about.
Core Components of an EDFA
The physics of stimulated emission and population inversion described in the previous section must be implemented in physical hardware — and remarkably, the same handful of components accomplishes this across virtually every EDFA, from compact telecom modules to high-power research amplifiers, with only their specifications varying.
Erbium-Doped Fibre: The Gain Medium
The erbium-doped fibre (EDF) is where amplification actually occurs: a length of single-mode silica fibre with erbium ions incorporated into the core, forming the active gain medium through which both pump and signal light propagate.
The gain spectrum of the EDF spans roughly 1525–1565 nm, covering the telecom C band, but its shape is not fixed — it depends on the average degree of excitation of the erbium ions across the fibre length, as well as the fibre's physical length and erbium concentration.
Core co-dopants have a pronounced effect on the gain spectrum and on how densely erbium can be loaded into the fibre without performance degradation. Aluminium co-doping supports higher erbium concentrations (several hundred parts per million) before ion clustering causes cooperative up-conversion and nonradiative pump power loss; germanium co-doping requires erbium concentrations below roughly 100 ppm to avoid the same effect.
Beyond concentration limits, aluminium co-doping produces flatter and broader gain spectra in the 1545–1560 nm region compared with germanium or phosphorus co-doping — a direct consequence of how the local glass matrix modifies the Stark-split energy sublevels of the erbium ions.
Pump Laser Diodes
Pump laser diodes are the energy source that drives population inversion in the EDF; without sufficient pump power, the erbium ions remain in their ground state and the fibre absorbs rather than amplifies the signal.
Two pump wavelengths dominate practical EDFA designs: 980 nm and 1480 nm, each with a distinct performance profile. At 980 nm, maximum gain efficiencies as high as 11 dB/mW have been demonstrated; at 1480 nm, efficiencies up to 6.3 dB/mW have been reported — making 980 nm the preferred choice where low noise is the priority.
The 1480 nm pump excites erbium ions directly into the metastable upper laser level, whereas 980 nm pumping first populates a higher-lying level that rapidly decays into it; the consequence is that high excitation levels — and therefore gain at shorter signal wavelengths near 1535 nm — are practically only achievable with 980 nm pumping.
Pump power directly sets the available gain and the maximum output power the amplifier can deliver: more pump power produces more excited erbium ions, which in turn provides more gain for the signal — the practical expression of the population inversion mechanism described earlier.
WDM Coupler
The WDM coupler (also called a wavelength-division multiplexing coupler or dichroic fibre coupler) combines the pump wavelength and the signal wavelength onto a single fibre so that both travel through the EDF together.
A simple beam splitter cannot perform this function efficiently — it would introduce substantial insertion loss on both the pump and signal paths. The WDM coupler achieves wavelength-selective combining with very low insertion loss, which matters because any loss at this stage directly reduces the pump power reaching the gain medium and degrades the amplifier's efficiency.
Optical Isolators
Optical isolators are one-way transmission devices that block light from propagating backwards through the amplifier, preventing back-reflections from re-entering the gain medium.
In a high-gain EDFA, even a small reflected fraction of the output can be re-amplified on its return path, leading to oscillation and gain instability — and in extreme cases, to uncontrolled lasing within the amplifier cavity formed by the reflections.
Isolators are typically placed at both the amplifier input (to block reflections arriving from upstream) and the output (to prevent downstream reflections from re-entering); treating them as optional in a practical EDFA design is not viable.
Gain-Flattening Filters
The erbium gain spectrum is inherently non-uniform: the 1530 nm region exhibits a pronounced gain peak at high excitation levels, while the gain is lower and flatter across the 1545–1565 nm range — meaning different signal wavelengths in a WDM system receive substantially different amounts of amplification without correction.
A gain-flattening filter (GFF) addresses this by presenting a wavelength-dependent transmission profile that is approximately the inverse of the EDFA gain spectrum: higher attenuation where gain is highest, lower attenuation where gain is lowest, producing a net gain that is substantially more uniform across the band.
The specific technologies used to implement GFFs — and more advanced approaches such as dynamic gain equalisers and two-stage amplifier designs — are covered in depth later in this guide.
Pumping Configurations
The same pump laser, WDM coupler, and EDF can be assembled in three distinct geometries, and the choice of geometry meaningfully shapes the amplifier's noise and power performance.
- Forward pumping: Pump and signal co-propagate. Pump is strongest at the fibre input where the signal is weakest, favouring a lower noise figure.
- Backward pumping: Pump counter-propagates against the signal. Pump is strongest near the output, supporting higher output power and better power conversion efficiency.
- Bidirectional pumping: Pump launched from both ends simultaneously. Combines the noise advantage of forward pumping with the power efficiency of backward pumping.
The direction of the pump wave does not affect small-signal gain, but it does influence power conversion efficiency and noise characteristics — with ASE propagating in the signal direction generally stronger in backward-pumped configurations, even though total ASE power losses can be lower.
Forward pumping favours noise figure; backward pumping favours output power efficiency. Bidirectional pumping is the practical route to achieving both simultaneously — at the cost of a second pump diode and WDM coupler.
The pumping configuration is therefore one of the fundamental design decisions in specifying an EDFA, and it is often determined by the amplifier's role in the optical link.
That question of role — how the same building blocks are configured differently when an amplifier sits at the transmitter output, mid-span, or receiver input — is exactly what the next section addresses.
EDFA Types: Booster, In-Line, and Pre-Amplifier
The physics of an EDFA is fixed — stimulated emission, population inversion, erbium gain in the C-band — but the engineering priorities shift dramatically depending on where in the link the amplifier is placed. A device optimised for launch power at the transmitter end would be the wrong choice at the receiver end, and vice versa. The three functional roles — booster amplifier, in-line amplifier, and pre-amplifier — each represent a distinct operating regime with different input signal conditions, different noise constraints, and different output power targets.
Booster Amplifier (Post-Amplifier)
The booster amplifier sits immediately after the transmitter, transponder, or wavelength multiplexer (MUX), before the signal has entered any fibre span. At this position the input signal is at its strongest — it has not yet suffered fibre attenuation — so the amplifier's job is to raise launch power to a level that can survive the first span, rather than recover a signal that has already degraded.
The primary requirements here are high saturated output power and good gain flatness across all WDM channels; in a DWDM system the MUX alone can consume several dB, and the combined channel group must enter the fibre with sufficient power to reach the next amplification point. Typical booster configurations target saturated output powers of +17 to +23 dBm, with small-signal gains in the range of 17–26 dB.
Noise figure is a secondary concern at the booster position: because the input signal-to-noise ratio is still high, the amplifier's own noise contribution has relatively little impact on the overall link OSNR budget. Gain flatness, by contrast, is critical — any channel-to-channel power imbalance introduced at the transmitter end propagates and accumulates through every subsequent amplifier stage.
In-Line Amplifier
In-line amplifiers are deployed at intermediate points along the transmission route, typically every 80–100 km on terrestrial systems, compensating accumulated span loss before the signal falls too close to the noise floor. A 100 km span of standard single-mode fibre at ~0.2 dB/km already accumulates ~20 dB of loss before connector, splice, and passive component losses are added — the in-line amplifier must recover this deficit at each stage.
This position imposes the most demanding balanced requirement of all three roles: the amplifier must deliver high gain to compensate span loss, maintain a low noise figure because the input signal is already substantially attenuated, and provide enough output power to drive the next span. Placement timing is critical — if the amplifier is inserted too late, after the signal has degraded severely, it amplifies noise alongside signal and compounds the OSNR penalty rather than correcting it.
Pre-Amplifier
The pre-amplifier is placed just before the receiver or demultiplexer (DEMUX), where the signal has traversed the full transmission link and is at its absolute weakest. Its role is to lift the signal above the receiver's detection threshold, improving receiver sensitivity before photodetection takes place.
At this position, noise figure becomes the paramount design requirement. Any noise the pre-amplifier adds is added to the weakest signal in the entire link, directly degrading bit-error rate at the receiver. This is why 980 nm pumping is often preferred for pre-amplifiers: as established in the preceding components section, 980 nm pumping achieves complete population inversion and a minimum noise figure below 4 dB, compared to 5.5 dB for 1480 nm pumping. Output power is less critical here than at the booster stage — the goal is clean, low-noise amplification, not high launch power.
The table below compares all three amplifier types across their primary performance axes, drawing on published performance figures from commercial telecom modules and academic characterisations.
| Amplifier Type | Position in Link | Primary Priority | Typical Gain (dB) | Typical NF Target (dB) | Typical Output Power (dBm) | Preferred Pump Wavelength |
|---|---|---|---|---|---|---|
| Booster | After transmitter / MUX, before first span | High saturated output power; gain flatness across WDM channels | 17–26 dB | 5–7 dB (less critical) | +17 to +23 dBm | 980 nm or 1480 nm |
| In-Line | Every 80–100 km along transmission span | Balanced: sufficient gain, low NF, adequate output power | 20–40 dB | 5–7 dB | +13 to +20 dBm | 980 nm or 1480 nm (dual pump common) |
| Pre-Amplifier | Just before receiver / DEMUX | Minimum noise figure; high small-signal gain | 20–30 dB | 4–6 dB (critical) | +13 to +16 dBm | 980 nm preferred |
Comparison of the three EDFA deployment types across position, primary priority, gain, noise figure, output power, and pump wavelength preference
The table makes the trade-off structure visible at a glance: the booster and pre-amplifier sit at opposite ends of the noise figure priority spectrum, with the in-line amplifier required to balance both axes simultaneously. A pre-amplifier operating at a noise figure of 4–6 dB with 980 nm pumping is well-matched to the weak-signal conditions it faces; a booster running at the same noise figure specification would be over-engineered for its position while potentially under-delivering on the output power a long first span demands.
The underlying engineering constraint is that output power and noise figure cannot both be simultaneously maximised in a single amplifier stage. Higher pump power and longer erbium-doped fibre drive output power upward, but they also increase amplified spontaneous emission (ASE), raising the noise floor. The amplifier type — booster, in-line, or pre-amplifier — is the engineering decision that resolves this tension by specifying which parameter to prioritise given the signal conditions at that point in the link.
Maximising output power and minimising noise figure pull in opposite directions in any single amplifier stage. The amplifier's position in the link — not the amplifier hardware alone — determines which parameter wins.
In live WDM networks, channel counts change as wavelengths are added or dropped, and without active control the gain per channel shifts, disrupting link budgets across the system. Two firmware-level mechanisms address this: in Automatic Gain Control (AGC) mode, the amplifier adjusts pump power to hold gain constant relative to input power, preserving per-channel power levels when the channel count changes; in Automatic Power Control (APC) mode, it adjusts pump power to hold total output power constant regardless of input power fluctuations.
With the three deployment roles established, the next step is to understand the parameters that quantify how well each amplifier performs its job — gain, noise figure, saturated output power, and gain flatness each carry a precise engineering meaning that shapes how an optical link is designed and how its performance is verified.
Key Performance Parameters
Selecting an EDFA from a datasheet is straightforward; specifying the right one for a given link requires knowing which numbers actually govern system performance and what the consequences are when any one of them falls short.
With the three amplifier roles established, the parameters that matter most to each role become concrete: a pre-amplifier lives or dies by its noise figure, a booster by its saturated output power, and an in-line amplifier must balance both alongside adequate gain.
- Gain: The ratio of output signal power to input signal power, expressed in dB. Typical small-signal gain for telecom EDFAs ranges from 20 to 40 dB.
- Noise Figure (NF): The measure of SNR degradation introduced by the amplifier, caused by amplified spontaneous emission. The quantum-limited minimum is 3 dB; practical EDFAs achieve 4–6 dB.
- Saturated Output Power: The output power at which gain has compressed by 3 dB relative to small-signal gain. Telecom modules typically deliver +17 to +23 dBm.
- Gain Flatness: The variation in gain across the amplified wavelength band, in dB. Raw EDFA gain is non-uniform across the C-band, with a pronounced peak near 1530 nm.
- Polarisation-Mode Dispersion (PMD): Pulse broadening caused by differential propagation velocities of the two orthogonal polarisation states. Relevant primarily for coherent transmission at 100G and beyond.
Gain sets the ceiling for what a span can tolerate: it must be matched to the actual loss the amplifier is compensating, since too little gain lets the signal drift toward the noise floor while too much overdrives the fibre and amplifies nonlinear impairments such as self-phase modulation, cross-phase modulation, and four-wave mixing.
The 20–40 dB figure quoted by IEEE applies to the small-signal gain regime, where input power is well below saturation; as input power rises, the gain begins to compress, which leads directly to the saturated output power discussion below.
The quantum-mechanical lower bound for noise figure in a high-gain, phase-insensitive amplifier is 3 dB — corresponding to an output noise power exactly twice that of a hypothetical noiseless device — and practical EDFAs achieve 4–6 dB, with 980 nm pumping tending toward the lower end of that range.
The underlying mechanism is amplified spontaneous emission (ASE): excited erbium ions emit photons spontaneously across the gain bandwidth, and those photons are amplified alongside the signal, degrading the optical signal-to-noise ratio at every stage.
In a cascaded multi-span link, ASE accumulates span by span — each amplifier amplifies the ASE contributed by all preceding stages — and this accumulation ultimately sets the reach limit of a system before optical-electrical regeneration is required.
A single amplifier with a degraded noise figure contributes a disproportionate share of total link ASE — particularly the first amplifier in the chain, which operates on the weakest signal. This is why per-amplifier NF acceptance testing matters in long-haul system commissioning, not just end-to-end OSNR measurement.
Gain compression defines the saturation regime: the standard reference point is the output power at which gain has fallen 3 dB below its small-signal value, and for telecom EDFA modules this saturation output power typically falls between +17 and +23 dBm.
For booster amplifiers, saturated output power is the primary figure of merit because it directly sets the maximum launch power into the first transmission span; for pre-amplifiers, operating well below saturation on weak received signals, it is much less critical.
Gain flatness describes how uniformly the EDFA amplifies across its operating wavelength band — and uniformity is not the natural state: the emission cross-section of erbium in silica glass peaks sharply near 1530 nm, creating a gain profile that is inherently non-uniform across the C-band.
In a WDM system, unequal gain means channels arrive at each successive amplifier at different power levels; over multiple spans this imbalance compounds, with high-gain channels accumulating nonlinear penalties and low-gain channels accumulating ASE noise — making gain flatness a fundamental requirement for WDM viability, not a cosmetic specification.
Polarisation-mode dispersion (PMD) — pulse broadening from differential propagation velocities of the two orthogonal polarisation states — is typically a minor contributor from the EDFA itself at lower bit rates, but engineers specifying amplifiers for coherent transmission at 100G, 400G, and beyond should verify the PMD figure, as accumulated PMD across a long chain of components becomes a meaningful impairment.
Gain flatness is the one parameter in this set that cannot be resolved by choosing a better amplifier alone — it requires deliberate engineering intervention, which is the subject of the next section.
See These Parameters in a Real EDFA
Translate the specs you just covered into a concrete design. Browse our custom EDFA range to see how gain, noise figure, and output power come together in real hardware built for your application.

Gain Flattening in EDFAs
The EDFA gain spectrum is not flat — and in a single amplifier stage, that non-uniformity is a manageable nuisance. In a cascaded multi-span system, it becomes a compounding, system-limiting problem that must be engineered against at every amplifier stage.
The root cause is the intrinsic emission and absorption cross-sections of erbium ions in a silica glass host. As established in the physics discussion earlier in this guide, those cross-sections are wavelength-dependent, producing a characteristic gain spectrum with a pronounced peak near 1530 nm and a broader, relatively flatter region from approximately 1540 to 1560 nm.
As noted in the key performance parameters section, this spectral shape means that without any correction, channels near the 1530 nm peak receive significantly more gain than channels at the longer-wavelength shoulder — with raw gain variation of 3–5 dB between the peak and the 1560–1565 nm region in a single amplifier stage, according to published system analyses.
The problem compounds with every span. Each amplifier in a chain multiplies the existing channel power imbalance rather than resetting it: if the strongest channel enters a span with 1 dB more power than the weakest, it exits with that advantage amplified further by the next EDFA's differential gain.
This compounding creates two distinct failure modes. Channels carrying excess power push the transmission fibre into nonlinear operating regimes, generating self-phase modulation (SPM), cross-phase modulation (XPM), and four-wave mixing (FWM) products that corrupt adjacent channels. Channels with insufficient power accumulate a growing proportion of ASE noise relative to signal, degrading their OSNR toward the detection threshold.
In a cascaded amplifier chain, gain non-uniformity accumulates with every span. A gain equalisation error of only 0.05 dB per amplifier can compound to a 5–10 dB channel power differential across a 120-amplifier long-haul link — which is why correction must be applied at each stage, not absorbed at the receiver.
Gain-Flattening Filters (GFF)
The primary passive correction tool is the gain-flattening filter (GFF) — an optical element whose wavelength-dependent transmission profile is the inverse of the EDFA gain spectrum: it attenuates where gain is high and transmits where gain is low, so the combined response of amplifier plus filter is substantially flat across the operating band.
Placement matters. In single-stage designs, the GFF is typically positioned at the amplifier output. In two-stage designs, it is placed between the two gain stages — a configuration that offers both gain flattening and a noise figure benefit discussed below.
Three principal technology families are used to implement GFFs, each with a distinct trade-off profile:
- Fibre Bragg Gratings (FBG): Long-period and slanted gratings couple light out of the guided mode in a wavelength-selective manner. All-fibre construction gives low excess loss and minimal back-reflection, but temperature compensation is required.
- Thin-Film Dielectric Filters: Stacked dielectric layers use interference to achieve the target transmission profile. Excellent environmental stability and design freedom; Furukawa's multilayer thin-film GFFs have demonstrated flatness of 0.19 dB with insertion loss below 0.1 dB.
- Mach-Zehnder Interferometers: Integrated waveguide structures use path-length differences to produce wavelength-selective attenuation. More fabrication-complex and costlier than LPG alternatives, but capable of programmable tuning when actively driven.
No single GFF technology dominates across all applications. Fibre Bragg gratings suit high-volume deployments where low insertion loss and all-fibre integration are priorities; thin-film dielectric filters are preferred when environmental stability and complex spectral shaping are required; Mach-Zehnder interferometer-based designs are more appropriate where adaptability or integration into planar waveguide platforms is the goal.
Dynamic Gain Equalisers and Two-Stage Design
A passive GFF is engineered for a fixed gain profile. When operating conditions vary — channel loading changes as wavelengths are added or dropped, or the gain profile shifts with temperature — a static filter cannot adapt. The dynamic gain equaliser (DGE) addresses this: an active, programmable device that adjusts per-wavelength attenuation in real time, responding to channel power monitoring to maintain flat output under changing conditions.
DGEs are the enabling component for dynamically reconfigurable DWDM networks, where traffic patterns evolve and amplifiers may see channel counts ranging from a handful to a full C-band complement over their operating life. The trade-off is cost and complexity: active devices with control electronics and monitoring infrastructure are substantially more expensive than passive GFFs, and their use is justified where network agility demands it.
The two-stage amplifier design is a particularly effective architecture that solves gain flattening while simultaneously improving noise performance. The signal passes through a first EDFA stage, which provides gain but also generates ASE; then through the GFF, which attenuates the high-gain wavelengths and partially filters the ASE produced in the first stage; then through a second EDFA stage, which amplifies the now-flattened spectrum to the target output power.
The noise benefit of mid-stage placement is non-trivial. ASE generated in the first stage is reduced by the GFF before it enters the second stage, so the second stage amplifies less ASE than it would if the filter were placed at the output of a single combined stage. RP Photonics notes that placing the gain-flattening filter between two amplifier stages avoids both the noise figure penalty of input filtering and the power efficiency penalty of output filtering — a meaningful improvement over either single-stage alternative.
With gain non-uniformity corrected at each amplifier stage — whether through a passive GFF, a mid-stage two-stage architecture, or an active DGE — the full potential of WDM channel scaling becomes accessible. The next section examines how these tools operate within complete WDM, DWDM, and FTTH system architectures.
EDFA in WDM, DWDM, and FTTH Systems
Every terabit-scale DWDM backbone carrying internet traffic across continents rests on a single, non-obvious physical property of erbium: its gain responds slowly — on a millisecond timescale — rather than tracking individual data bits at nanosecond speeds.
The upper-state lifetime of erbium ions is approximately 10 ms, which is orders of magnitude longer than the bit period of any practical data signal (0.1 ns at 10 Gb/s, for instance). Because the gain cannot respond to individual pulses, a single EDFA simultaneously amplifies every WDM channel present in its gain window without inter-channel crosstalk — the amplifier is, in effect, transparent to channel modulation.
This was not a guaranteed outcome: an amplifier with nanosecond-scale gain dynamics would produce severe cross-gain modulation, making simultaneous multi-channel amplification impractical. The long upper-state lifetime is precisely the property that made wavelength-division multiplexing at scale technically viable.
The erbium gain spectrum spans two distinct telecom windows. The C-band (approximately 1530–1565 nm) is the primary and most widely deployed window, coinciding with the lowest attenuation region of silica fibre. The L-band (approximately 1565–1625 nm) extends capacity further: accessed by operating erbium at lower population inversion levels, which shifts the gain peak toward longer wavelengths.
Deploying parallel C-band and L-band amplification chains extends the total usable amplification bandwidth to over 80 nm — a significant system capacity multiplier that operators use to scale DWDM channel counts well beyond what C-band alone supports.
The economic logic of DWDM becomes clear when considering channel density: a single EDFA can simultaneously amplify 80 or more channels at 50 GHz spacing across the C-band. The amplifier cost is amortised across every channel at once, unlike electronic regeneration, which required dedicated optoelectronic conversion hardware per channel — a cost that scaled linearly with channel count.
In long-haul terrestrial systems, in-line amplifiers are typically spaced at 70–100 km intervals, driven by the span loss accumulated at 1550 nm on standard single-mode fibre, which is approximately 0.2 dB/km. ITU-T recommendations — including G.692 and G.Sup39 — provide the planning framework for span loss budgeting in these systems, establishing the reference assumptions engineers use when dimensioning amplifier chains.
EDFA in FTTH and Passive Optical Networks
In fibre-to-the-home (FTTH) deployments, EDFA serves a fundamentally different purpose: compensating the optical loss introduced by passive splitters that divide a single fibre signal among many subscribers.
A passive optical network (PON) typically uses 1:32 or 1:64 split ratios — and sometimes higher. Each splitting stage introduces insertion loss (a 1:32 splitter introduces approximately 16 dB; a 1:64 splitter approximately 19–21 dB). Without amplification, this loss severely constrains either the reach of the network or the number of subscribers it can serve — EDFA extends both simultaneously.
EDFA also plays a distinct role in CATV-over-fibre deployments, where a 1550 nm video overlay signal is amplified at the headend and distributed across many passive splitter branches to deliver cable television services alongside broadband data.
In these deployments, the EDFA amplifies only the 1550 nm video signal — which falls within the C-band gain window — while the OLT data signals at 1310 nm and 1490 nm travel on separate wavelengths outside the EDFA's operational range, combined onto the same fibre via WDM couplers.
Returning to long-haul systems: as signals traverse a chain of amplified spans, each EDFA contributes amplified spontaneous emission (ASE) noise, and that noise accumulates. The tool engineers use to plan for this is the per-span OSNR formula.
OSNR ≈ 58 + P_launch − L_span − NF − 10·log(N) Where P_launch is per-channel launch power (dBm), L_span is span loss (dB), NF is amplifier noise figure (dB), and N is the number of amplifier spans. The constant 58 encodes the ASE quantum noise floor referenced to a 0.1 nm (12.5 GHz) measurement bandwidth at 1550 nm.
Each term has a direct physical interpretation: higher launch power improves OSNR; greater span loss degrades it; lower noise figure preserves it; and the 10·log(N) term captures how ASE powers from successive amplifiers accumulate additively at the receiver.
The practical consequence of the logarithmic scaling is significant: doubling the number of spans costs exactly 3 dB of OSNR, not half the OSNR. A 10-span link carries 10 dB worse OSNR than a single span; a 100-span link, 20 dB worse. This is why noise figure — discussed in the previous section — compounds so consequentially across a multi-span system, and why §11's link budget planning discussion treats it as a primary design constraint.
With EDFA's system-level strengths now established — simultaneous multi-channel amplification in DWDM, scalable capacity through C+L band architectures, and reach extension in FTTH/PON — the natural next question is where the alternatives fit: the following section examines the trade-offs between EDFA and the two competing optical amplifier technologies, Raman and SOA, and the scenarios where each is the better engineering choice.
EDFA vs. Raman and SOA: Comparing Optical Amplifier Technologies
With a thorough understanding of how EDFAs work, where they are deployed, and what governs their performance, the natural next question is: where does an EDFA fit relative to the other amplifier technologies an engineer might reach for?
Three technology classes define the optical amplifier landscape: EDFA (lumped gain in erbium-doped fibre), Raman amplifiers (distributed gain in the transmission fibre itself), and semiconductor optical amplifiers (SOAs) (chip-scale, electrically pumped gain). Each occupies a distinct engineering design space — and in the most demanding systems, more than one is deployed simultaneously.
| Parameter | EDFA | Raman Amplifier | SOA |
|---|---|---|---|
| Gain mechanism | Stimulated emission from erbium ions in doped silica fibre; optically pumped at 980 nm or 1450 nm | Stimulated Raman scattering in the transmission fibre; pump ~100 nm shorter than signal | Stimulated emission in an electrically pumped semiconductor p-n junction; chip-scale device |
| Noise figure | 4–6 dB (approaching 3 dB quantum limit with 980 nm pumping) | Effective NF <4 dB; can be <0 dB in counter-propagating distributed configurations | 7–9 dB; 3 dB worse than EDFA, compounding over multiple amplifier stages |
| Gain / bandwidth | 30–50 dB gain; ~35 nm (C-band) or ~30 nm (L-band) | 10–25 dB on-off gain; ~100 nm per pump wavelength; multiple pumps enable wideband coverage | 15–25 dB gain; 60–100 nm bandwidth; wavelength range set by semiconductor material |
| Form factor | Fibre-based module; requires pump laser diode and WDM coupler | Remote pump laser injected into transmission fibre; no discrete gain medium at amplification point | Chip-scale (~0.5–2 mm active region); integrable on photonic integrated circuits (PICs) |
| Primary use cases | C/L-band long-haul and DWDM; FTTH PON; submarine; metro core | Ultra-long-haul OSNR improvement; S-band coverage; hybrid pre-amplification for EDFA | Optical switching; wavelength conversion; PIC integration; short-reach datacenter interconnects |
| Key limitation | Gain confined to erbium emission window (~1525–1620 nm); lumped noise addition at each node | Pump power ~1 W+ required; gain transients cause crosstalk; double Rayleigh backscattering ceiling | NF 7–9 dB limits long-haul use; gain saturation at low power constrains multi-channel WDM |
Comparison of EDFA, Raman, and SOA optical amplifiers across key engineering axes.
The table reveals a clear pattern: EDFA leads on gain magnitude and noise figure for lumped amplification; Raman leads on distributed gain and wavelength flexibility; SOA leads on integration density and switching speed. No single technology dominates across all axes, which is precisely why the choice is an engineering decision rather than a default.
Raman Amplifiers: Distributed Gain and Wavelength Flexibility
Raman amplification exploits stimulated Raman scattering directly in the transmission fibre, with a pump wavelength approximately 100 nm shorter than the target signal wavelength (corresponding to a frequency offset of roughly 13 THz for silica). Because the gain is distributed continuously along the fibre span rather than concentrated at a discrete node, the signal is never allowed to fall as low as it would in a purely lumped EDFA-only system.
The noise advantage is significant: distributed counter-propagating (backward-pumped) Raman configurations achieve effective noise figures below 4 dB, and the effective noise figure can appear negative — a genuine OSNR benefit for ultra-long-haul systems that EDFA alone cannot replicate. Wavelength flexibility is equally compelling: any signal wavelength can be amplified by selecting an appropriate pump, making Raman the only practical option for S-band amplification where erbium provides little gain.
The trade-offs are real, however. Pump power requirements are on the order of 1 W or more, which carries laser safety implications for field-deployed fibre. In co-propagating (forward-pumped) configurations, Raman gain reacts essentially instantaneously to pump power fluctuations, coupling pump noise directly onto the signal and creating crosstalk risk — counter-propagating pump geometry substantially mitigates this, which is why most telecom Raman amplifiers use backward pumping. At high gain levels (above roughly 15–20 dB), double Rayleigh backscattering creates a multipath interference noise floor that limits achievable gain, and gain per unit length remains far lower than in EDFA.
Semiconductor Optical Amplifiers: Integration and Speed
An SOA produces gain through stimulated emission in an electrically pumped semiconductor p-n junction — essentially a laser diode with anti-reflection coatings replacing the end mirrors to allow single-pass amplification. The active region is a chip-scale waveguide of roughly 0.5–2 mm in length, and the gain bandwidth is determined by the semiconductor material composition rather than a fixed ionic emission window, giving SOAs coverage across the O, S, C, and L bands depending on material choice.
The practical advantages of SOAs are architectural: they are electrically pumped (no pump laser required), fabricable on the same substrate as other photonic components in a photonic integrated circuit (PIC), and their gain dynamics operate on a nanosecond timescale — orders of magnitude faster than EDFA's millisecond response. That speed makes SOAs the preferred gain element for optical switching, wavelength conversion via cross-gain modulation, and all-optical signal processing applications.
Against EDFA, the disadvantages are equally concrete. Noise figures of 7–9 dB (versus 4–6 dB for EDFA) compound over multi-stage links, making SOAs unsuitable for long-haul multi-span applications. Gain saturation occurs at relatively low optical power, which introduces crosstalk between WDM channels sharing the same active region. The amplification is intrinsically polarisation-dependent unless mitigated by special designs such as twin-SOA configurations, and nonlinear distortions (self-phase modulation, four-wave mixing) are significantly stronger than in EDFA at comparable power levels.
Hybrid EDFA+Raman: Combining Both Technologies
In ultra-long-haul terrestrial and submarine systems, EDFA and Raman amplification are routinely deployed together rather than as alternatives. The architecture is complementary: a backward-pumped Raman amplifier injects high-power pump light into the transmission fibre at the output end of each span, providing distributed low-noise gain across the span and improving OSNR before the signal reaches the inline EDFA node. The EDFA then provides the high lumped gain needed to fully restore signal power.
The combination delivers measurable system-level gains. Lightwave Online's analysis of ultra-long-haul systems documents an OSNR improvement of approximately 6–7 dB per span with distributed Raman pre-amplification, which translates directly into extended unregenerated reach — a DWDM signal that traverses roughly six 80 km spans (approximately 500 km) without regeneration in an EDFA-only system can reach up to twelve spans (approximately 1,000 km) with Raman assistance. In operational terms, this can eliminate entire inline amplifier nodes, reducing both capital cost and failure points in the link.
In the most demanding long-haul systems, EDFA and Raman amplification are not competing choices — they are complementary layers of the same link design. Raman reduces the noise floor across the span; EDFA provides the lumped gain at the node. The question in ultra-long-haul engineering is not which technology to use, but how to combine them optimally.
Translating this into a practical decision framework: EDFA is the default for C-band and L-band long-haul WDM — mature, high gain, low noise figure, simultaneous multi-channel amplification. Raman supplements EDFA for ultra-long-haul OSNR improvement or S-band coverage, and is rarely a standalone telecom replacement. SOA is the right choice for photonic integration, optical switching, and wavelength conversion where EDFA's fibre-based form factor or wavelength coverage is a constraint. Hybrid EDFA+Raman is the architecture for systems where OSNR budget is the binding constraint and the added complexity of dual-technology amplification is justified — primarily submarine and ultra-long-haul terrestrial links.
With the technology landscape now mapped, the next consideration is how to translate that selection into a working system — the practical engineering decisions around amplifier placement, link budget, noise accumulation, and integration that determine whether an EDFA performs as required in the field.
Practical Deployment and Integration Considerations
There is a gap between understanding how an EDFA works and knowing how to integrate one into a real optical system — and it is wider than most technical guides acknowledge. The physics, the components, the performance parameters: all of that knowledge becomes actionable only when applied to the specific engineering decisions a link actually demands.
Link Budget Planning
The correct starting point for any amplified link is not the amplifier datasheet — it is the receiver's required OSNR, worked backwards through the link to determine what each amplifier must deliver.
The industry-standard per-span planning formula is: OSNR = 58 + P_launch − L_span − NF − 10·log(N), where P_launch is the per-channel launch power in dBm, L_span is the span loss in dB, NF is the amplifier noise figure in dB, and N is the number of spans.
The constant 58 is not arbitrary — it is −10·log(h·ν·B_ref) evaluated at 193.4 THz over a 12.5 GHz (0.1 nm) reference bandwidth, the standard OSNR measurement convention per ITU-T G.697.
A typical long-haul EDFA carries a noise figure of 5–6 dB; the formula tells the engineer immediately whether a given combination of span loss, launch power, and amplifier count closes the link to the required OSNR margin.
Amplifier Spacing
Amplifier spacing is an engineering optimisation, not a fixed rule: wider spacing reduces infrastructure cost and network complexity, but every additional kilometre of uncompensated fibre loss degrades the per-span OSNR budget.
The table below summarises typical spacing parameters across the three principal deployment contexts, using G.652 standard single-mode fibre at approximately 0.2 dB/km attenuation at 1550 nm as the reference.
| Deployment | Typical Spacing | Typical Span Loss (G.652, ~0.2 dB/km) | Primary Spacing Driver |
|---|---|---|---|
| Terrestrial long-haul | 80–100 km | 16–20 dB | Infrastructure hut placement; cost vs. OSNR trade-off |
| Submarine | 35–40 km | 7–8 dB | OSNR budget; no regenerators over thousands of km |
| Metro / regional | 40–80 km | 8–16 dB | Node locations; mix of OSNR and cost constraints |
Comparison of EDFA amplifier spacing, span loss, and primary spacing driver across terrestrial long-haul, submarine, and metro/regional deployments.
Terrestrial systems tolerate 80–100 km spans because regeneration nodes can be placed at equipment huts along the route; submarine systems tighten spacing to 35–40 km precisely because there are no regenerators across ocean distances, and every fraction of a dB in per-span OSNR margin compounds over hundreds of amplifier stages.
Fibre type also influences the decision: G.652 SMF accumulates chromatic dispersion at roughly 17–18 ps/nm·km in the C-band, which means dispersion compensation modules (DCMs) are typically inserted at inline amplifier sites — adding insertion loss that must be factored into the span loss budget.
Noise Accumulation Across Cascaded Amplifiers
ASE powers from successive amplifiers add linearly across spans, so the receiver OSNR degrades by 10·log(N) as the number of spans N increases — a 3 dB penalty each time the span count doubles.
The practical consequence is that a single amplifier with an elevated noise figure contributes a disproportionate share of the total link ASE budget: one amplifier running at 9 dB NF in a chain designed for 5 dB NF adds roughly six times the ASE power of a correctly-performing unit, capable of degrading the end-of-link OSNR by several dB on its own.
Because ASE accumulates linearly, the end-of-link OSNR penalty is 10·log(N) — a 16-span link carries 12 dB more accumulated noise penalty than a single-span reference at the same per-span NF and launch power. One degraded amplifier with an elevated NF can dominate the total link ASE budget, which is why per-amplifier NF acceptance testing is a system-level requirement.
This is why per-amplifier NF acceptance testing matters at commissioning: a degraded pump laser or an incorrectly-set gain point can elevate NF by several dB without triggering any obvious alarm, yet silently consume a large fraction of the link's OSNR margin.
Operating Band, Output Power, and Pulse Regime
C-band (1530–1565 nm) remains the default for standard WDM deployments; L-band (1565–1625 nm) is the first expansion step when C-band capacity is exhausted; and dual C+L operation effectively doubles the available transmission window, with implementations demonstrated to more than double network capacity compared to C-band alone.
From an integration standpoint, running separate C-band and L-band amplifiers means separate sources, separate cables, and additional management overhead at every amplifier site. Woodrow Scientific's Custom EDFA addresses this directly: it delivers both C-band and L-band through a single cable from one source, eliminating the need for a second amplifier and meaningfully simplifying cable management and integration architecture.
Beyond band selection, the pulse regime is a fundamental specification variable. Standard telecom uses continuous-wave (CW) operation; LiDAR, free-space optical communications (FSOC), sensing, and directed-energy applications require pulsed operation with demanding peak power and pulse energy requirements.
Commercially available erbium-fibre amplifiers now reach pulse energies above 10 mJ, peak powers above 100 kW, and average powers above 100 W — figures that place high-power erbium fibre firmly in the category of mature, commercially deployable technology rather than a laboratory speciality. Woodrow Scientific's Custom EDFA is engineered to these leading commercially available power levels, and is configurable across operating band, output power, pulse regime, pulse energy, and peak power to match the specific demands of the application.
Form Factor, Cooling, and Control Interfaces
Form factor is an engineering decision that shapes system architecture — an amplifier that does not fit the integration envelope is not fit for purpose regardless of its optical performance.
- Rack-mount modules: Standard 1U or 2U 19-inch rack units for telecom infrastructure; straightforward to deploy in equipment rooms and amplifier huts.
- Compact OEM modules: Smaller form factors for system integration where board space or enclosure volume is constrained.
- Custom integration envelopes: Bespoke mechanical packaging for embedded, airborne, maritime, or other space-critical applications where standard form factors do not fit.
Thermal management is closely linked to form factor choice. Air cooling is appropriate for standard telecom power levels; water cooling becomes necessary as average output power increases into the high-power regime. An amplifier running near its thermal limit degrades faster and introduces reliability risk — under-cooling is one of the most common causes of premature pump laser degradation in deployed systems.
Woodrow Scientific's Custom EDFA is available with either air or water cooling, specified at the design stage to match the thermal environment of the target application — not retrofitted after the fact.
Control firmware is the final integration variable that is frequently underweighted at the specification stage. The two standard operating modes are AGC (automatic gain control), which holds gain constant as input power varies, and APC (automatic power control), which holds output power constant.
Communication interfaces across deployed EDFA products typically include RS-232, USB, and Ethernet. An amplifier that cannot expose the right protocol for the system's control architecture creates integration friction that is expensive to resolve after hardware is committed. Custom firmware is a genuine engineering requirement for demanding or novel applications.
Supplier Depth as an Integration Variable
In the EDFA market, a significant proportion of suppliers are resellers or importers rather than manufacturers. That distinction has direct consequences during integration: a reseller cannot modify the product, cannot provide in-house engineering support when the integration encounters an edge case, and cannot offer the depth of technical engagement that a complex amplifier deployment may require.
Slower access to spares, limited ability to diagnose or resolve product-level issues, and no path to application-specific modification are the practical costs of working with a supplier that does not own its own design and manufacturing process.
Woodrow Scientific Limited designs, builds, qualifies, and supports its own amplifiers entirely in-house, on patented technology, with engineering expertise rooted in Southampton's Optoelectronics Research Centre — the institution where the EDFA was invented in the 1980s by Professor Sir David Payne and colleagues. That lineage is not a marketing credential; it is the basis for the direct engineering support WSL provides throughout integration, from initial specification through commissioning.
With these engineering variables — link budget, amplifier spacing, noise accumulation, band selection, power regime, form factor, cooling, and control interfaces — mapped to real system requirements, the reader is equipped to move from understanding EDFA technology to specifying an amplifier for an actual deployment. The following summary consolidates the key takeaways from across this guide.
Ready to Design Your EDFA System Integration?
From link budget to deployment, our experts can help you specify the right EDFA solution for your optical system. Explore our free-space optical communications technology or book a call to discuss your design.

Conclusion
Summary and Next Steps
EDFA's dominance in fibre-optic communications reflects a structural fit between erbium's gain physics and the wavelength window, capacity demands, and WDM architecture of modern long-haul networks.
Understanding the physics and specifying an amplifier correctly for a given system are two distinct disciplines — and the second is where real-world performance is won or lost.
For readers moving toward specification, the logical next step is engaging a supplier who engineers an amplifier end-to-end to the application — configured to the band, power, pulse regime, and integration envelope of the work, not selected from a fixed catalogue.
Frequently Asked Questions About EDFAs
Common technical questions about EDFA operating principles, performance parameters, and how they compare to other optical amplifier technologies.
EDFAs are used primarily as optical amplifiers in fibre-optic communications, serving three deployment roles: as a booster amplifier placed after the transmitter to raise launch power into a fibre span; as an in-line amplifier positioned between spans to compensate for accumulated fibre loss; and as a pre-amplifier placed just before the receiver to improve signal-to-noise ratio at detection. Beyond telecom, EDFAs are used in LiDAR systems requiring high-power 1550 nm pulses, free-space optical communications (FSOC) where signal power must survive atmospheric path loss, distributed fibre sensing (including distributed acoustic sensing and structural monitoring), and high-power industrial and defence applications that exploit the eye-safe wavelength and EDFA power-scaling capability.
Typical small-signal gain for telecom EDFA modules is 20–40 dB. High-gain pre-amplifier designs can reach 40 dB or more. The actual gain depends on erbium-doped fibre (EDF) length, pump power, and whether the amplifier is operating in the small-signal or saturated regime — saturated gain is lower than small-signal gain because the available inversion is partially depleted by a strong input signal. In system design, gain must be matched to actual span loss: too little gain leaves the link power-starved; too much overdrives the fibre into nonlinear impairment.
EDFA uses a short length of erbium-doped fibre as a lumped gain medium, amplifying signals in fixed C-band (1530–1565 nm) or L-band (1565–1625 nm) windows. Raman amplifiers exploit stimulated Raman scattering in the transmission fibre itself, providing distributed gain at any wavelength determined by the pump — typically 100 nm shorter than the signal. EDFA offers higher gain per unit length, lower cost, and simpler implementation, making it the standard choice for most long-haul deployments. Raman offers a lower effective noise figure — distributed configurations can achieve a sub-zero effective NF by boosting signals before they reach their minimum power — along with wavelength flexibility and reduced nonlinear penalty from the distributed gain profile. Because Raman gain is practically limited by double Rayleigh backscattering at high gain levels, the two technologies are often combined: hybrid EDFA+Raman configurations use Raman for distributed pre-amplification and EDFA for lumped gain, and are standard practice in ultra-long-haul terrestrial and submarine systems.
EDFAs amplify in the C-band (1530–1565 nm) and L-band (1565–1625 nm). The C-band coincides with the loss minimum of standard silica single-mode fibre at approximately 0.2 dB/km, which is why it became the dominant window for long-distance optical communications. C-band is by far the most widely deployed; L-band is accessed by operating erbium at lower population inversion levels and extends total usable bandwidth for high-capacity systems. Dual C+L architectures cover the full 1530–1625 nm window, effectively doubling available spectrum for DWDM systems with high channel counts.
The theoretical minimum noise figure (NF) for an EDFA is 3 dB, set by quantum optics as the fundamental limit for any phase-insensitive optical amplifier operating at high gain. Practical devices typically achieve 4–6 dB. Pump wavelength has a direct effect: 980 nm pumping achieves a lower NF (around 4 dB) than 1480 nm pumping (typically 5–6 dB) because it produces a higher degree of population inversion. NF is most critical in pre-amplifiers, where it directly sets the receiver sensitivity floor, and in cascaded long-haul systems where amplified spontaneous emission (ASE) accumulates across every span — each amplifier stage adds noise that subsequent stages amplify, making per-amplifier NF a compounding factor over the full link.
Gain flattening is the process of correcting the non-uniform gain spectrum of an EDFA so that all wavelength channels receive equivalent amplification. Without correction, the erbium gain profile peaks sharply near 1530 nm and falls toward 1560–1565 nm, producing a raw gain variation of 3–5 dB per amplifier stage across the C-band. In a DWDM system, this imbalance compounds with every span: channels with excess power drive nonlinear impairments (self-phase modulation, cross-phase modulation, four-wave mixing); channels with insufficient power accumulate disproportionate ASE noise and degrade in OSNR. Gain-flattening filters (GFF) apply a wavelength-dependent attenuation profile that is the inverse of the EDFA gain spectrum, correcting channel power imbalance to within approximately ±0.5 dB per span in terrestrial long-haul systems. Dynamic gain equalisers (DGE) perform the same function with a programmable, real-time-adjustable attenuation profile, accommodating variable channel loading as traffic patterns change.