

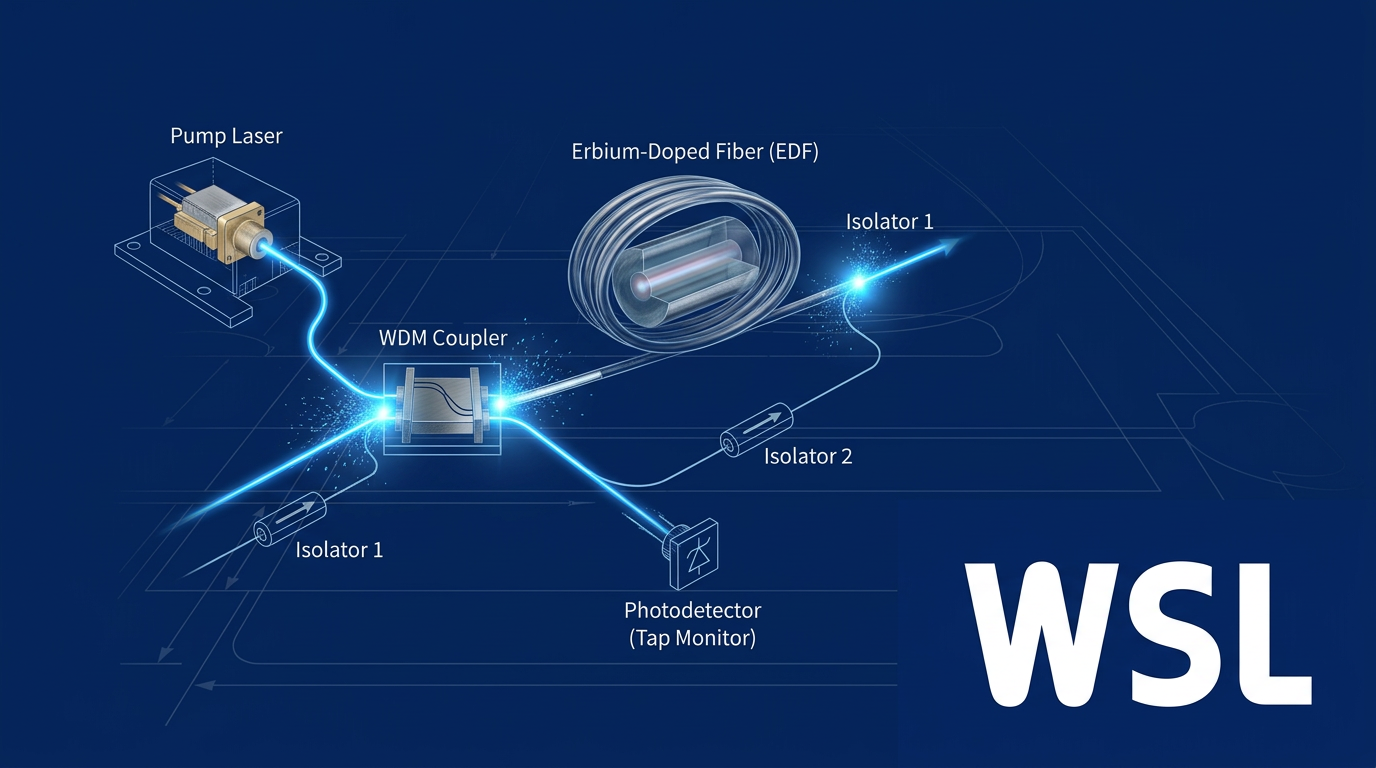
Introduction
If you are working with EDFA-based optical systems at a design level, you already know the basics — this guide is not here to cover those.
What it offers instead is a structured, diagram-anchored walkthrough of how an EDFA is actually put together: how its components interconnect, how the physics of amplification plays out within that structure, and how architectural choices around pump wavelength, pumping geometry, and amplifier configuration drive real performance outcomes.
The shift from knowing what a component is to understanding why it sits where it does in the signal path — and what changes when its placement or configuration changes — is where surface familiarity becomes design-level expertise.
TL;DR
An EDFA block diagram is not a static schematic — it is a map of interconnected design decisions. Pump wavelength, pumping geometry, isolation strategy, and configuration type are not independent choices; each shapes the others, and together they determine amplifier performance. Understanding those dependencies is what separates a component list from genuine system-level knowledge.
This article covers:

Component roles and signal flow in the EDFA block diagram
Amplification physics within the block diagram structure
Pump wavelength and geometry as architectural decisions
Gain, noise figure, and ASE as design outcomes
Booster, pre-amplifier, and in-line EDFA configurations
What is an EDFA Block Diagram?
Most engineers can define an EDFA in a sentence. Far fewer can look at an EDFA block diagram and explain why each element sits where it does — what the diagram encodes about signal flow, energy injection, and system constraints rather than simply which parts are present.
An Erbium-Doped Fibre Amplifier is a specific class of optical amplifier whose gain medium is a length of silica optical fibre with trivalent erbium ions (Er³⁺) incorporated into its core.
The EDFA delivers optical gain to signals in the C-band (approximately 1525–1565 nm), and the term refers not to the doped fibre alone but to the complete assembly of components built around that gain medium — the full system is what the block diagram maps.
In long-haul and metropolitan optical fibre transmission links, optical signals lose power progressively as they propagate through fibre — a fundamental consequence of attenuation.
EDFAs restore that lost signal power entirely in the optical domain, without converting the signal to an electrical form and back, which means a single amplifier can simultaneously boost every channel in a WDM or DWDM transmission band without per-channel processing.
The reason the EDFA became the dominant amplifier technology for long-haul optical communications is a matter of physical alignment: the erbium gain window coincides precisely with the lowest-loss transmission window of silica optical fibre.
The C-band (approximately 1525–1565 nm) and L-band (approximately 1565–1625 nm) are where silica fibre is most transparent, and erbium's gain bandwidth covers both — making the EDFA the natural fit for the infrastructure that carries the world's long-haul optical traffic.
The EDFA block diagram is best understood not as a static illustration but as a system-level map: a schematic that traces the signal path from input to output, marks the point at which pump laser light is injected, and shows how the gain medium, coupling, and isolation stages relate to one another as an integrated system.
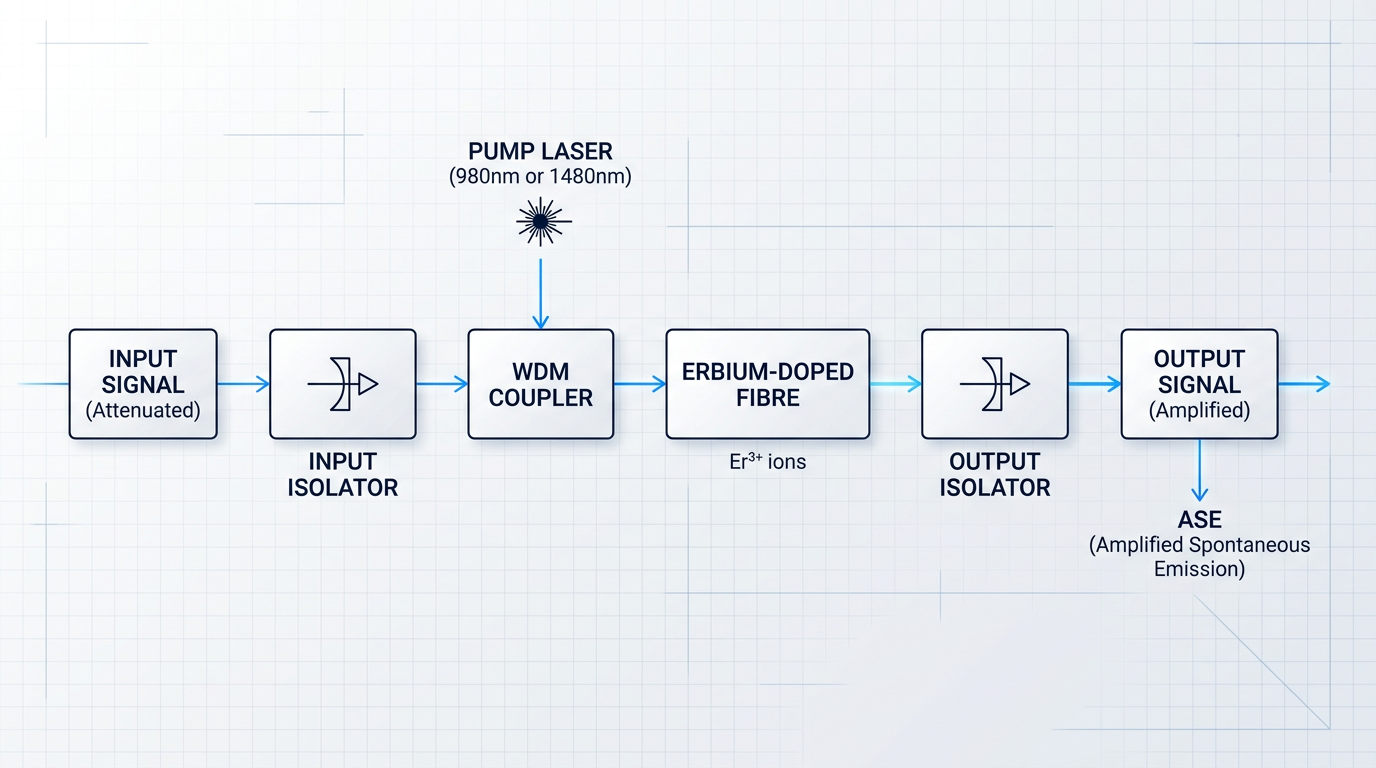
What the diagram encodes is relationships, not just inventory: the position of each component relative to the signal path is itself a design decision, and the block diagram makes those decisions visible at a glance.
Reading the block diagram as a signal-flow map, three inputs and outputs become apparent: the incoming optical signal (weakened after transmission through fibre), the pump laser light injected to energise the gain medium, and the amplified output signal accompanied by ASE (amplified spontaneous emission) — a noise contribution that is an unavoidable by-product of optical amplification and one this guide addresses in detail.
Every component in the EDFA block diagram occupies a specific position in the signal path for a reason. The diagram encodes the relationships between those components — and understanding those relationships is what separates system-level EDFA knowledge from surface familiarity.
The major functional blocks the diagram contains — the erbium-doped fibre, the pump laser, the WDM coupler, and the optical isolators — each play a distinct role in that integrated system, and each will be examined in the sections that follow.
With the system-level picture established, the next step is to examine what each of those functional blocks does — and critically, why their positions within the signal path are not arbitrary.
Core Components of the EDFA Block Diagram
The EDFA block diagram is not a parts inventory — it is a map of functional dependencies. Every component occupies a specific position because the signal flow and the noise risks at that position demand it. Relocate any one element and the amplifier either degrades, oscillates, or fails to amplify at all.
The Erbium-Doped Fibre: Where Amplification Happens
At the centre of every EDFA block diagram sits the erbium-doped fibre (EDF) — a length of silica glass whose core has been doped with trivalent erbium ions (Er³⁺). This is the only stage in the diagram where the signal is actually amplified; every other component exists either to prepare the conditions for that amplification or to protect the signal from degradation before and after it occurs.
The EDF's position at the centre of the block diagram is not incidental — it is structurally definitive. Strip away the pump laser, the couplers, and the isolators, and what remains is simply a passive optical fibre. The EDF only becomes a gain medium when the surrounding architecture delivers the right conditions to it.
Pump Laser Diodes: The Engine Behind the Gain
The pump laser diode is the energy source that drives the entire amplification process. These are semiconductor diode lasers that inject optical power into the EDF at a wavelength absorbed by erbium ions, exciting them into higher energy states where stimulated emission — and therefore gain — becomes possible.
The two dominant pump wavelengths used in practice are 980 nm and 1480 nm, each with distinct absorption characteristics in erbium-doped silica. Both are valid architectural choices for the pump laser position in the block diagram; the trade-offs between them are addressed in the following section on pump wavelength selection.
Without the pump laser, the EDF is inert — a passive waveguide that attenuates rather than amplifies. Its position in the block diagram, injecting power upstream of or alongside the EDF, is what converts a length of doped fibre into a working gain medium.
The WDM Coupler: Where Energy Meets Signal
The WDM coupler (wavelength-division multiplexing coupler) solves a fundamental physical constraint: the pump light and the signal light must co-propagate through the same EDF, but they originate from entirely separate sources. The coupler's wavelength-selective design allows it to combine both onto a single fibre without one interfering with the other.
Its placement in the block diagram — between the pump laser output and the EDF input — is precisely determined by this function. Positioning the WDM coupler anywhere after the EDF would be architecturally incoherent: the pump energy would never reach the gain medium, and amplification could not occur.
Optical Isolators: Sentinels at the Amplifier Boundaries
Optical isolators are passive magneto-optic devices that enforce unidirectional propagation — light passes forward freely, while reverse-travelling light is suppressed. In the EDFA block diagram, isolators appear at both the input and the output of the amplifier, and their placement at each boundary is determined by a specific threat.
The input isolator prevents back-reflections from the WDM coupler and the EDF from propagating back toward the signal source, which would corrupt the incoming signal and potentially destabilise upstream laser transmitters. The output isolator blocks amplified spontaneous emission (ASE) travelling in the reverse direction through the gain medium, and suppresses spurious feedback oscillations that would otherwise build up and destabilise the amplifier.
Remove either isolator and the block diagram's noise and stability boundaries collapse. The isolators are not placed at the input and output as a matter of convention — they are placed there because those are precisely the points where reflection and ASE risks are highest.
Signal Path Integration: Why the Order Matters
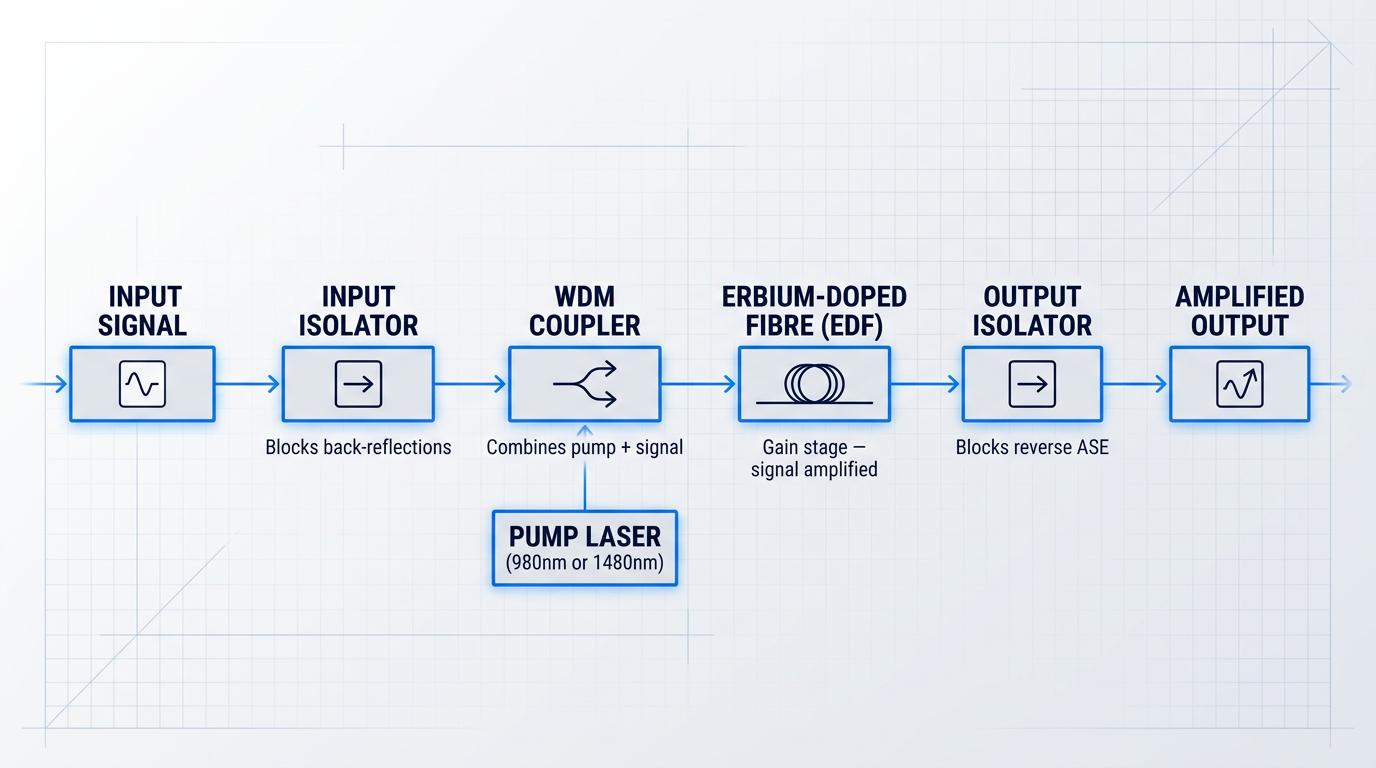
The canonical EDFA signal path follows a sequence in which each stage's position is causally justified by what the preceding stage requires and what the following stage cannot tolerate. The order is the architecture.
- Input Isolator: The signal enters through an isolator first, before any other component. This blocks back-reflections from the coupler and EDF from reaching the upstream source.
- WDM Coupler: The cleaned signal is combined with pump light here. Placement between the isolator and EDF ensures pump energy enters the gain medium co-directionally with the signal.
- Erbium-Doped Fibre: With pump and signal co-propagating, the EDF provides gain. This is the only stage where signal power actually increases.
- Output Isolator: The amplified signal exits through a second isolator, which blocks reverse-travelling ASE and prevents feedback oscillations from re-entering the gain medium.
The isolator precedes the WDM coupler — not follows it — because the reflection risk originates from the coupler junction itself. Placing the isolator after the coupler would leave the signal source exposed to exactly the reflections it is designed to block. Sequence is not arbitrary; it is the solution to a cascade of physical constraints.
In the EDFA block diagram, where a component sits is inseparable from what it does. Every placement decision is a direct response to the signal flow direction and the noise or reflection risk at that exact boundary — not a design convention inherited from tradition.
That causal logic is most clearly seen when the entire signal path is visualised in sequence, with each component's role and boundary annotated in context.
Advanced Block Diagram Extensions
Production-grade EDFA designs extend the core block diagram with additional elements that address gain stability and spectral purity requirements beyond what the canonical four-component schematic provides.
- Tap Coupler and Photodetector: A small fraction of output power is tapped and monitored by a photodetector, feeding a control loop that adjusts pump laser drive current to maintain constant gain.
- Optical Bandpass Filter: Placed at the output to suppress out-of-band ASE, this filter is particularly important in multi-stage and in-line configurations where ASE accumulation compounds across spans.
These extensions do not represent separate amplifier architectures — they are additions to the same signal path, layered on when design requirements move beyond basic amplification into gain-controlled or spectrally managed operation.
With the block diagram's architecture and component relationships established, the natural next question is what is physically happening inside the EDF itself when the pump and signal light co-propagate through it — and that is where the physics of amplification begins.
How an EDFA Works: The Physics of Amplification
The erbium-doped fibre stage sits at the heart of the block diagram, but the diagram alone does not tell you why it amplifies — it only shows that it does. The mechanism behind the gain is a sequence of quantum transitions in Er³⁺ ions, driven by the pump light the WDM coupler injects into the EDF, and understanding that sequence is what makes every subsequent design decision legible.
The Three-Level Energy System of Er³⁺ Ions
Erbium ions embedded in silica glass operate as a three-level gain system, and each level plays a distinct functional role in the amplification process.
- E1 — Ground State (⁴I₁₅/₂): The lowest energy level. Ions rest here by default; this is the level that must be depopulated to achieve gain.
- E2 — Metastable Level (⁴I₁₃/₂): The upper laser level. Its comparatively long radiative lifetime allows ions to accumulate here, enabling population inversion to build.
- E3 — Pump Excited State (⁴I₁₁/₂): A short-lived intermediate level populated by 980 nm pump absorption. Ions decay rapidly and non-radiatively to E2.
The long lifetime of the metastable state (E2) is the critical design enabler: ions arriving from E3 accumulate in E2 far faster than they spontaneously decay back to E1, creating the population imbalance that makes amplification possible.
Inside the EDF stage of the block diagram, this process is set in motion the moment pump light from the WDM coupler enters the doped fibre. Each 980 nm pump photon is absorbed by a ground-state Er³⁺ ion, promoting it to E3 (⁴I₁₁/₂).
From E3, the ion undergoes rapid non-radiative decay to E2 (⁴I₁₃/₂) — too fast to emit a useful photon, but fast enough to continuously feed the metastable reservoir.
Because the E2-to-E1 spontaneous decay rate is orders of magnitude slower than the E3-to-E2 non-radiative decay rate, ions pile up in E2 along the length of the EDF, building population inversion: a condition where more ions occupy E2 than E1.
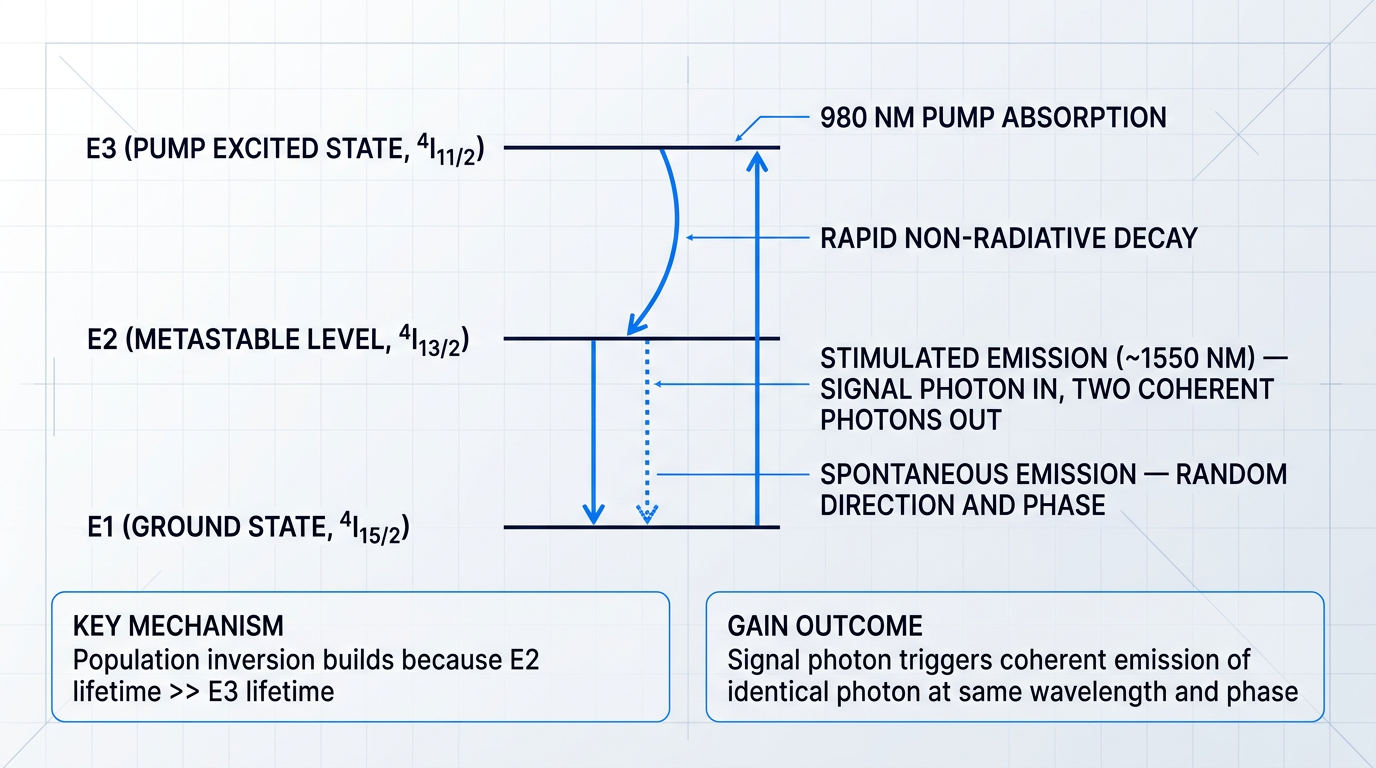
The diagram above shows the full transition sequence: a 980 nm pump photon drives E1→E3 absorption; rapid non-radiative decay carries the ion to E2; a signal photon near 1550 nm then triggers stimulated emission, returning the ion to E1 and releasing a second coherent photon identical in wavelength, phase, and direction; and occasionally an ion decays spontaneously, emitting a photon in a random direction.
From Population Inversion to Optical Gain
Once population inversion is established in the EDF, an incoming signal photon at approximately 1550 nm encounters a medium primed to amplify rather than absorb it.
The signal photon interacts with an excited Er³⁺ ion at E2, stimulating a downward transition to E1. The ion releases a second photon at the same wavelength, phase, and direction as the original — this is the mechanism of optical gain, and it repeats along every centimetre of inverted fibre in the EDF stage.
Without population inversion, the same medium would absorb the signal: ground-state ions at E1 would outnumber those at E2, and incoming signal photons would be consumed rather than multiplied. The inversion condition is not a refinement — it is the prerequisite.
Not every excited ion waits for a signal photon to trigger its decay. Some ions at E2 emit spontaneously, releasing photons in random directions and at random phases across the gain bandwidth. When these spontaneous photons propagate along the EDF, they are themselves amplified by the same gain medium, emerging at the output as broadband noise — a phenomenon known as amplified spontaneous emission (ASE).
ASE is not a design flaw; it is an inescapable consequence of the gain mechanism itself. It is the dominant noise source in EDFAs, and its relationship to inversion level and amplifier architecture will be examined in detail when performance parameters are addressed.
Stark Splitting and the Broadband C-Band Gain Window
A natural question at this point is why an EDFA amplifies across a continuous band of wavelengths rather than at a single discrete frequency — after all, the energy levels described above are discrete quantum states.
The answer lies in the amorphous structure of silica glass. In a crystalline host, each Er³⁺ ion would sit in an identical electric field environment, and the energy levels would be sharp and discrete, yielding gain at only one wavelength. In silica glass, the local electric field varies from site to site — each ion occupies a slightly different environment.
This site-to-site variation causes each discrete energy level to split into a continuous distribution of sub-levels, a phenomenon known as Stark splitting. The cumulative effect across all the erbium ions in the EDF is a smooth, broadband gain spectrum rather than a single gain line.
Stark splitting in the amorphous silica glass host broadens the discrete Er3+ energy levels into continuous bands, producing gain across a wide window in the C-band (approximately 1530–1565 nm). This is the physical reason a single EDFA can simultaneously amplify dozens of WDM channels — it is a property of the glass host, not of erbium alone.
The practical consequence for system designers is significant: the same EDF stage amplifies channels spread across the C-band simultaneously, without any wavelength-specific tuning.
Spatial Distribution of Gain Along the EDF
The amplification process described above does not occur at a single point in the EDF stage — it is distributed along the entire fibre length, and that distribution is non-uniform in a way that has direct consequences for amplifier design.
As pump light propagates through the doped fibre from the WDM coupler injection point, it is progressively absorbed by ground-state Er³⁺ ions. Pump power is therefore highest at the injection end and diminishes along the fibre length.
Where pump power is high, population inversion is strong and gain per unit length is at its maximum. Further along the EDF, where pump power has been substantially depleted, the inversion level falls and so does the local gain contribution.
Simultaneously, the signal grows as it propagates through the inverted medium, being amplified incrementally along the fibre. The result is a coupled spatial evolution: pump power falling, signal power rising, and inversion level varying continuously along the EDF length.
This spatial picture is the physical foundation for understanding why the direction from which pump light enters the EDF changes the amplifier's noise and gain characteristics — a question that the next section addresses through the choice of pump wavelength, and which pumping geometry discussions will develop further.
Pump Wavelength: 980 nm vs 1480 nm
Of all the specifications visible in an EDFA block diagram, the pump laser wavelength is the one that tells you the most about the amplifier's intended role — because the choice between 980 nm and 1480 nm is not a component preference but a mechanistic commitment, one whose consequences ripple through noise figure, power efficiency, wavelength stabilisation requirements, and ultimately where in the system the amplifier belongs.
Both wavelengths drive population inversion in Er³⁺ ions, but they do so through fundamentally different paths — and that difference in mechanism is the root of every performance trade-off that follows.
Why 980 nm Achieves Near-Complete Population Inversion
As established in the physics section, 980 nm photons excite Er³⁺ ions from the ground state (E1, ⁴I₁₅/₂) up to the short-lived pump level (E3, ⁴I₁₁/₂), from which they undergo rapid non-radiative decay — with a lifetime of approximately 1 µs — down to the metastable E2 level (⁴I₁₃/₂).
Because the E3 lifetime is so short and the E2 metastable lifetime is so long (~10 ms), ions accumulate almost entirely in E2 under continuous pumping — the upper lasing level fills up and stays full, enabling essentially complete population inversion.
Critically, there is no overlap between the 980 nm pump band and the stimulated emission band: pump photons cannot trigger downward transitions from E2 to E1, so the inversion is not self-limiting at any pump power level.
Why 1480 nm Has a Fundamental Inversion Ceiling
The 1480 nm pump operates via a two-level-like process: photons excite ions directly from the lower sublevel of E1 to the upper sublevel of E2, bypassing E3 entirely.
The critical problem is that 1480 nm falls within the region where erbium's absorption and stimulated emission bands overlap — meaning pump photons can also induce downward transitions from E2 back to E1, directly competing with the inversion process.
This overlap imposes a hard ceiling on achievable inversion: no matter how much pump power is applied, complete population inversion is physically unachievable with 1480 nm pumping, and the resulting incomplete inversion translates directly into a higher noise figure.
980 nm pumping achieves near-complete population inversion because the three-level path through E3 decouples pump absorption from stimulated emission — pump photons cannot trigger downward transitions. At 1480 nm, the overlapping absorption and emission bands mean pump photons simultaneously drive both upward and downward transitions, making complete inversion impossible regardless of pump power. This is not an engineering limitation to be engineered around; it is a consequence of the erbium energy structure itself.
In practice, the UCSB ECE 228B lecture data quantifies the gap clearly: the minimum achievable noise figure for a 980 nm-pumped EDFA is below 4 dB, while the 1480 nm minimum is 5.5 dB — a gap that persists across operating conditions and cannot be closed by system-level optimisation.
This makes 980 nm the unambiguous choice wherever noise performance is the dominant design constraint — most critically in pre-amplifier stages, where the input signal is at its weakest and any added noise degrades the downstream signal-to-noise ratio irreversibly.
The Power Efficiency Advantage of 1480 nm
The counterbalancing advantage of 1480 nm lies in its smaller quantum defect: the energy difference between a 1480 nm pump photon and a 1550 nm signal photon is far smaller than the equivalent gap for 980 nm, meaning less energy is lost as heat per photon converted.
The Lightwave Online data makes this concrete: converting a 980 nm photon (1.265 eV) to a 1550 nm signal photon is approximately 50% less power-efficient than using a 1480 nm photon (0.838 eV) for the same conversion — a substantial difference in optical conversion efficiency, confirmed by the UCSB pump source data showing 35% optical conversion efficiency at 980 nm versus 50% at 1480 nm.
Beyond photon economy, 1480 nm light also experiences lower propagation loss in silica fibre than 980 nm light — which falls outside the standard telecom operating window and suffers from higher Rayleigh scattering — making 1480 nm pump energy far more transmissible over long distances.
This propagation advantage is what makes 1480 nm the preferred pump wavelength for remotely pumped amplifiers in submarine cable systems, where the pump laser at the terminal must deliver sufficient power to an erbium-doped fibre block located up to 85–100 km away — a distance over which 980 nm power would be largely exhausted before reaching the gain fibre.
The table below compares both pump wavelengths across the key performance dimensions that govern the design decision.
| Parameter | 980 nm Pump | 1480 nm Pump |
|---|---|---|
| Pump mechanism | Three-level: E1 → E3 → E2 via non-radiative decay (~1 µs at E3) | Two-level-like: E1 → E2 directly, bypassing E3 |
| Achievable inversion | Near-complete; no stimulated emission by pump photons | Fundamentally incomplete; absorption/emission band overlap limits inversion ceiling |
| Minimum noise figure | < 4 dB (practical devices typically 4–6 dB) | 5.5 dB minimum; inherently higher due to incomplete inversion |
| Optical conversion efficiency | ~35% (pump photon to signal photon) | ~50% (smaller quantum defect, less heat per converted photon) |
| Wavelength stabilisation | Required: narrow Er absorption band (976–984 nm, -3 dB); FBG stabilisation needed for complex EDFAs | Generally not required: broader, flatter Er absorption above ~1450 nm reduces sensitivity to wavelength drift |
| Fibre propagation loss | Higher (outside standard telecom window; greater Rayleigh scattering) | Lower; transmissible over tens to hundreds of km for remote pumping |
| Typical application | Pre-amplifiers, low-noise in-line amplifiers, metro network EDFAs | High-power booster amplifiers, remotely pumped submarine EDFAs, multi-stage high-power designs |
Side-by-side comparison of 980 nm and 1480 nm pump wavelengths across the performance parameters that drive EDFA design decisions, using specific measured and published data.
The table makes clear that neither wavelength is universally superior: 980 nm dominates wherever noise figure is the binding constraint, while 1480 nm wins wherever power efficiency, raw output power, or pump delivery distance is the primary requirement.
The practical decision heuristic is straightforward: if the amplifier sits at the front end of a receiver chain or at a point in the link where signal power is lowest, 980 nm is the correct choice; if the amplifier is boosting power at the transmit end, operating in saturation, or pumping a remote gain fibre, 1480 nm is the better fit — and high-power multi-stage designs frequently combine both, using a 980 nm first stage for low noise and a 1480 nm second stage for high output power.
Wavelength Stabilisation: A Real Engineering Cost
The erbium absorption band at 980 nm is narrow — only 976 to 984 nm at the -3 dB points in silica — which means even a few nanometres of pump laser wavelength drift can cause measurable degradation in gain and noise figure.
Complex EDFAs using 980 nm pumps therefore typically require fibre Bragg grating (FBG) stabilisation: the FBG is placed externally to the pump diode and provides narrowband optical feedback that locks the diode's emission to the Bragg wavelength, preventing the temperature-driven drift that would otherwise occur as drive current and junction temperature vary.
At 1480 nm, the erbium absorption spectrum is considerably broader and flatter above approximately 1450 nm, which reduces sensitivity to pump wavelength drift and generally eliminates the need for FBG stabilisation in standard designs — a meaningful reduction in component count and system complexity.
FBG stabilisation is not prohibitively expensive, but it adds a real cost and alignment requirement to the pump module; in volume deployments, the difference in stabilisation requirements between 980 nm and 1480 nm pump designs is a factor engineers weigh alongside noise figure and efficiency.
Reading Pump Wavelength from the Block Diagram
The pump wavelength choice is directly legible in the EDFA block diagram at two points: the pump laser label (980 nm diode vs. 1480 nm diode) and the WDM coupler specification (a 980/1550 nm coupler vs. a 1480/1550 nm coupler).
From those two labels alone, an engineer reading the diagram can immediately infer the amplifier's noise figure character, its likely application context, and whether FBG stabilisation is likely present in the pump module — without needing to read the accompanying specification sheet.
With the pump wavelength established as one axis of the pump architecture decision, the next question the block diagram poses is directional: which way does that pump light travel through the erbium-doped fibre — co-propagating with the signal, counter-propagating, or both simultaneously — and what does that choice do to the noise figure and output power profile?
Pumping Geometries: Forward, Backward, and Bidirectional Configurations
Wavelength selection, as covered in the previous section, determines the energy available for population inversion. But wavelength alone does not fix the block diagram's topology — the second architectural variable is the direction in which pump light travels through the erbium-doped fibre, and that choice fundamentally reshapes which ends of the EDF carry WDM couplers, where pump lasers appear in the diagram, and what performance profile the amplifier delivers.
Forward (Co-Propagating) Pumping
In forward pumping, pump light and signal travel in the same direction through the EDF — a co-propagating arrangement where both enter at the signal input end, combined by a single WDM coupler placed before the fibre.
This geometry concentrates population inversion at the input end of the EDF, precisely where the incoming signal is at its weakest — and therefore most vulnerable to noise added by amplified spontaneous emission.
The consequence for noise figure is favourable: the signal encounters the most highly inverted medium at the very moment it enters the gain medium, suppressing the relative contribution of spontaneous emission noise at the critical early stage of amplification.
Backward (Counter-Propagating) Pumping
In backward pumping, the pump laser is injected at the signal output end of the EDF via a second WDM coupler positioned after the fibre — a counter-propagating arrangement where pump and signal travel in opposite directions.
The inversion profile is inverted relative to forward pumping: the pump reservoir is concentrated at the output end, where the signal is already strong, rather than at the input where it is weak and ASE noise is most damaging — which is why backward pumping carries a higher noise figure penalty.
The trade-off is output power: because the pump energy is concentrated where the signal intensity is highest, backward pumping enables more stimulated emission at the output stage, supporting higher gain and higher output power than forward pumping can achieve at equivalent pump levels.
Bidirectional Pumping
Bidirectional pumping places pump lasers at both ends of the EDF simultaneously, with WDM couplers at both the input and output sides of the fibre — the block diagram now shows two pump injection points bracketing the gain medium.
This configuration produces the most uniform inversion profile along the fibre length, sustaining high inversion across the full EDF rather than concentrating it at one end — delivering the highest achievable gain values while moderating the noise figure penalty relative to pure backward pumping.
The cost is real: additional pump lasers, two WDM couplers, and the control complexity of managing two pump sources increase component count and system expense, making bidirectional pumping the standard choice for in-line amplifiers in high-channel-count WDM systems where both noise figure and output power must be managed across many cascaded spans.
| Geometry | Noise Figure | Output Power / Gain | Complexity | Typical Application |
|---|---|---|---|---|
| Forward (co-propagating) | Lowest — high inversion at signal input | Moderate | Low — single WDM coupler, one pump laser | Pre-amplifier |
| Backward (counter-propagating) | Higher — low inversion at signal input | High — pump reservoir at output stage | Low-moderate — single WDM coupler at output end | Booster amplifier |
| Bidirectional | Moderate — uniform inversion profile | Highest — sustained inversion across full EDF | High — dual WDM couplers, two pump lasers | In-line amplifier (WDM systems) |
Structured comparison of the three EDFA pumping geometries across noise figure, output power, gain, complexity, and typical application — enabling engineers to assess the architectural trade-offs at a glance.
The table makes the core trade-off explicit: no single geometry dominates across all axes, and the right choice is determined by where the amplifier sits in the transmission system and which performance parameter is the binding constraint.
For a system designer, the practical implication is that forward pumping and backward pumping each optimise for a single axis — noise figure or output power respectively — while bidirectional pumping is the engineering compromise that avoids sacrificing either, at the cost of a more complex block diagram.
Geometry and wavelength are not independent variables — they interact, and their combination determines the amplifier's functional identity in the system.
Co-pumping with a 980 nm laser maximises inversion at the signal input and minimises noise figure, making it the natural fit for pre-amplifier stages where the input signal is weakest. Counter-pumping with a 1480 nm laser concentrates power at the output stage and maximises launch power, making it the natural fit for booster applications.
Multi-stage designs routinely exploit both simultaneously: a 980 nm co-pump on the first stage establishes a low noise figure at the signal input, while a 1480 nm counter-pump on the second stage drives high output power at the signal output — a standard engineering pattern that treats geometry and wavelength as a single integrated decision, not two sequential ones.
Combining a 980 nm co-pump on the first stage with a 1480 nm counter-pump on the second stage is the established architecture for high-performance in-line amplifiers — it simultaneously minimises noise figure at the signal input and maximises output power at the signal output, a result neither geometry nor wavelength achieves alone.
In bidirectional configurations, the dual-pump topology introduces a specific block diagram consequence: mid-stage isolators are required between stages to suppress backward-propagating ASE generated at the output stage, which would otherwise travel back into the first stage and degrade its noise figure — the placement of those isolators in the diagram is not a default, it is a direct consequence of the bidirectional pumping geometry chosen.
With the pump configuration now fully defined across both wavelength and geometry, the resulting gain, noise figure, and ASE behaviour can be understood as direct architectural outcomes — which is precisely what the next section addresses.
Gain, Noise Figure, and ASE as Architectural Outcomes
The components and configurations examined in the preceding sections do not exist in isolation — they produce measurable consequences that determine whether an EDFA meets its system requirements. Gain, noise figure, and amplified spontaneous emission are not specifications a designer selects from a catalogue; they are outcomes that emerge directly from the block diagram's architecture.
Gain: What the Block Diagram Configuration Produces
Small-signal gain in a practical EDFA is not a fixed property of the device — it is the result of four interdependent variables that the block diagram encodes.
- EDF length: Longer fibre provides more erbium ions for interaction with the signal, but excessive length introduces re-absorption losses that erode net gain.
- Pump power: Higher pump power drives more ions into the excited state, increasing available gain up to the limits the architecture can sustain.
- Erbium ion concentration: Doping concentration sets the density of gain sites per unit length; too high and ion-ion interactions degrade efficiency.
- Population inversion level: The fraction of erbium ions in the excited state at any point along the fibre determines the local gain coefficient.
These variables are not independent knobs — changing EDF length without adjusting pump power shifts the inversion profile along the fibre, altering both gain magnitude and spectral shape.
Gain is therefore tunable within limits set by the architecture, which is precisely why the EDFA block diagram is a design document rather than a schematic for a fixed device.
Gain Saturation: An Operating Regime, Not a Defect
Gain saturation occurs when a strong input signal depletes the excited-state population faster than the pump can replenish it, causing gain to fall as input power rises.
This is not a failure mode — it is a well-defined operating regime that every system designer must account for, and it becomes particularly significant when the amplifier handles high input powers, as explored in the configuration discussion that follows this section.
Gain Spectrum Non-Uniformity and Flattening
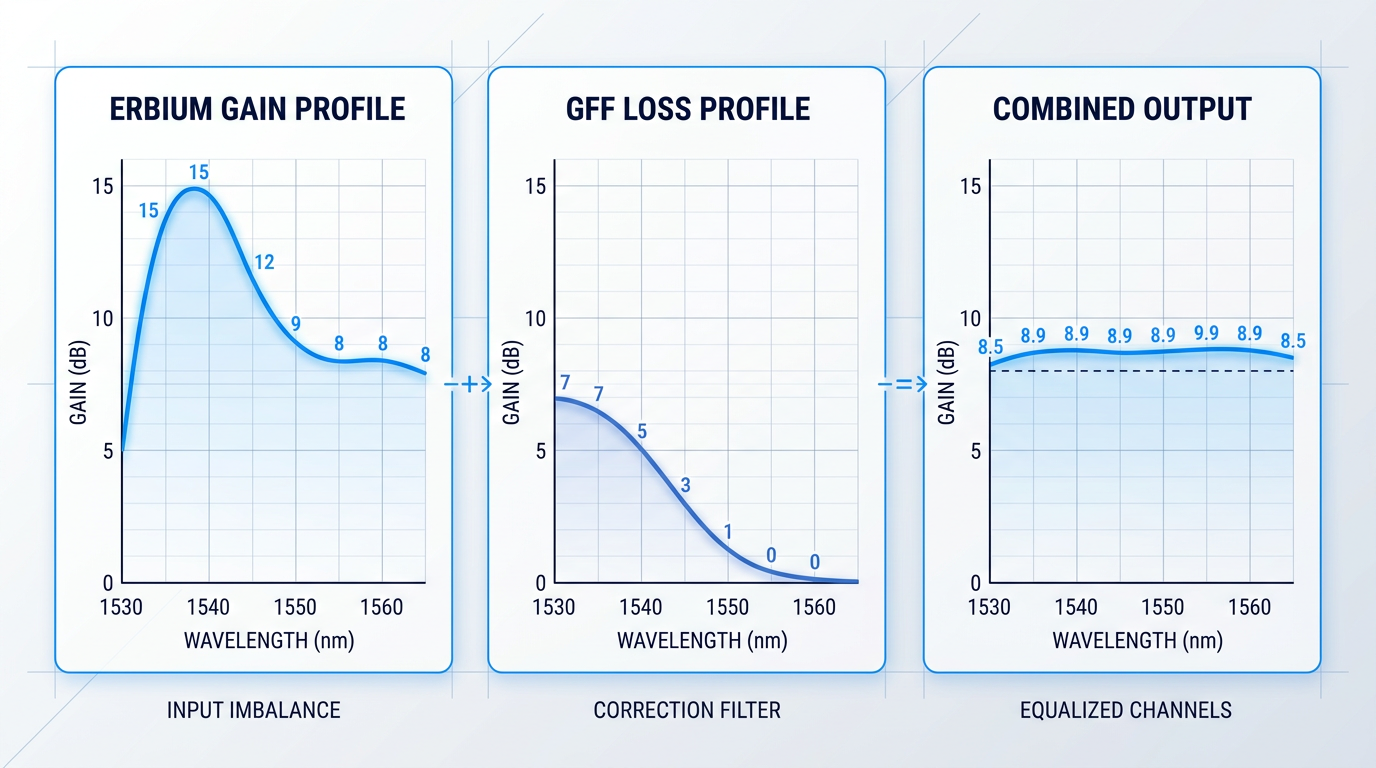
The erbium gain profile across the C-band is inherently non-flat: a pronounced gain peak exists in the shorter-wavelength portion of the C-band, while longer C-band wavelengths experience lower, flatter gain.
In a WDM system carrying multiple wavelength channels simultaneously, this means shorter-wavelength channels receive substantially more gain than those at longer wavelengths — a disparity that compounds with each successive amplifier in a long-haul chain, eventually producing unacceptable channel-power imbalances.
The architectural response is the gain flattening filter (GFF): a component — implemented via fibre Bragg gratings or thin-film filters — that imposes a complementary loss profile, attenuating the high-gain wavelengths to equalise output power across channels.
In a dual-stage EDFA design, the GFF is typically inserted between the two gain stages, where it can act on the signal before the second stage amplifies any residual non-uniformity further.
The GFF's inclusion is a direct consequence of a performance requirement: the block diagram evolves to accommodate it, which is the clearest illustration that the diagram is a living map of design decisions rather than a fixed reference schematic.
Noise Figure and ASE: The Noise Side of the Architecture
Noise figure quantifies the degradation in signal-to-noise ratio that the amplifier introduces: it is the ratio of input SNR to output SNR, expressed in decibels.
A fundamental quantum mechanical limit constrains how low noise figure can go for any high-gain optical amplifier, and practical EDFAs approach but do not reach that limit — the gap above it is determined largely by the inversion level at the signal input end of the EDF.
As established in the pump wavelength and geometry discussions, forward (co-propagating) pumping delivers the highest inversion level at the signal input end, which is why this configuration consistently achieves the lowest noise figures in practice.
The dominant factor governing noise figure is the population inversion level where the signal first enters the erbium-doped fibre. Architecture choices — pump wavelength and pumping geometry — that maximise inversion at that point directly minimise noise figure.
Backward pumping, while advantageous for output power, presents a lower inversion level at the input end — and the noise figure reflects that trade-off directly.
ASE Accumulation in Cascaded Amplifier Chains
Amplified spontaneous emission is the fundamental noise floor of any EDFA: photons emitted spontaneously by excited erbium ions are themselves amplified along the EDF, exiting alongside the signal as broadband noise.
In a single amplifier, ASE is manageable — but in a long-haul transmission link where multiple EDFAs are cascaded, each amplifier adds its own ASE contribution, and the cumulative effect degrades the optical signal-to-noise ratio (OSNR) of the entire system.
This is why the optional optical filters identified in the block diagram's component layer serve a concrete performance function: by rejecting out-of-band ASE before it reaches the output, they preserve OSNR budget for downstream spans.
The system-level implication is that noise figure and ASE cannot be evaluated for a single amplifier in isolation — their consequences are cumulative, and the block diagram of each amplifier in the chain contributes to a shared noise budget.
With these performance outcomes established, the natural next question is how they shape the block diagram when an EDFA is deployed in a specific role — as a booster, a pre-amplifier, or an in-line amplifier — each of which makes different architectural trade-offs in response to exactly the parameters covered here.
EDFA Configuration Types: How the Block Diagram Varies
Every principle covered so far — component placement, pump wavelength selection, pumping geometry, gain saturation, noise figure — converges at a practical question: what does the EDFA block diagram actually look like when the amplifier is deployed? The answer is that there is no single schematic. There is a family of architectures, each shaped by where the amplifier sits in the transmission link and what signal conditions it must handle at that position.
Booster Amplifier: Maximising Output Power
The booster amplifier sits immediately after the transmitter, before the signal enters the long-haul fibre span — a position where the input signal is already at relatively high power and the amplifier's job is to maximise the launch level into the transmission medium.
Operating in the saturated gain regime, the booster prioritises output power over noise figure: because the signal-to-noise ratio is still high at this point in the link, a less-than-ideal noise figure is tolerable.
The block diagram signature of a booster reflects this priority directly: the WDM coupler for pump injection sits at the output end of the erbium-doped fibre, delivering a counter-propagating 1480 nm pump — the wavelength and geometry combination established earlier as the configuration that favours high output power over minimum noise figure.
The EDF length in a booster is typically shorter than in a pre-amplifier, optimised for saturation rather than small-signal gain; input and output isolators are both present to suppress back-reflections.
Pre-Amplifier: Minimising Noise Figure
The pre-amplifier occupies the opposite end of the link, positioned just before the photodetector or coherent receiver after the signal has traversed the full transmission span and reached its most attenuated state.
At this position, the dominant design constraint is noise figure: amplifying an extremely weak signal in the small-signal gain regime means any added noise directly degrades the receiver's ability to recover the data.
The block diagram encodes this priority through a forward-pumped 980 nm architecture — the WDM coupler injects pump light co-propagating with the signal at the input end of the EDF, achieving the highest population inversion density where the signal first enters the gain medium and yielding the lowest achievable noise figure.
Isolator placement is particularly critical in the pre-amplifier: the input isolator must block any optical feedback from the amplifier back into the preceding fibre span, since back-reflections into an already-weak signal path would compound noise degradation at the worst possible point in the link.
In-Line Amplifier: Balancing Gain and Noise
The in-line amplifier is deployed mid-span at regular intervals along the transmission route, compensating for accumulated fibre loss and restoring the signal to a level that will survive the next span.
Unlike the booster or pre-amplifier, the in-line configuration cannot sacrifice either noise figure or output power: the signal must traverse multiple further spans, and ASE accumulates across each amplifier in the chain, so every individual stage's noise contribution compounds at the system level.
The block diagram of an in-line amplifier is topologically the most complex of the three, and its distinguishing feature is the mid-stage access point between two EDF stages — a break in the gain medium where dispersion compensation modules (DCMs) or gain flattening filters (GFFs) are inserted.
Bidirectional pumping — with WDM couplers at both ends of the EDF injecting pump light from both directions simultaneously — is the standard geometry for in-line amplifiers, achieving higher gain values and improved gain uniformity along the fibre length; a mid-stage isolator suppresses backward ASE from the second EDF stage degrading the first.
Taken together, the three configurations span the full design space of EDFA deployment — and the table below maps the key architectural axes across all three.
| Configuration | Link Placement | Signal Condition at Input | Pump Wavelength | Pump Geometry | Performance Priority | Block Diagram Signature |
|---|---|---|---|---|---|---|
| Booster (Power) Amplifier | After transmitter, before long-haul fibre | High power — transmitter output | 1480 nm | Counter-propagating (backward) | Maximum output power; noise figure secondary | WDM coupler at EDF output end; shorter EDF; input and output isolators |
| Pre-Amplifier | Before receiver, after full transmission span | Very low power — maximally attenuated | 980 nm | Co-propagating (forward) | Minimum noise figure; high small-signal gain | WDM coupler at EDF input end; critical input isolator; EDF optimised for small-signal operation |
| In-Line (Line) Amplifier | Mid-span at regular intervals | Significant loss — must restore to launch level | 980 nm and/or 1480 nm | Bidirectional | Balance of noise figure and output power | Dual EDF stages; mid-stage access point for DCM or GFF; WDM couplers at both EDF ends; mid-stage isolator |
Comparison of the three EDFA configuration types across placement, signal condition, pump wavelength, pump geometry, performance priority, and block diagram distinguishing features.
The table makes the design logic visible: pump wavelength and injection geometry are not arbitrary choices — they are direct expressions of the performance priority demanded by the amplifier's position in the link, and both are immediately readable from the block diagram.
The topological complexity also scales with link position: the booster and pre-amplifier are single-stage architectures with a clear primary objective, while the in-line amplifier's dual-stage EDF with mid-stage access is the block diagram signature of a device that must serve multiple system-level functions simultaneously.
A 980 nm co-pumped architecture signals a pre-amplifier optimised for minimum noise figure; a 1480 nm counter-pumped architecture signals a booster optimised for output power; bidirectional pumping with a mid-stage access point signals an in-line amplifier balancing both. An engineer who can read the pump labels and coupler positions can identify the configuration type from the schematic alone.
This architectural logic extends beyond individual amplifiers when many in-line EDFAs operate in series across a long-haul link: ASE generated by each amplifier is itself amplified by every subsequent stage, so noise accumulates across the chain in a way that no single amplifier's noise figure specification can fully capture.
Gain non-uniformity across the C-band compounds in the same way — a channel receiving marginally more gain than its neighbour at each stage sees an exponentially growing power advantage by the end of a multi-span system, which is precisely why gain flattening filters at the mid-stage access point of in-line amplifiers are a system-level design requirement rather than a single-amplifier refinement.
The EDFA's suitability for DWDM systems rests on a physics property established earlier in this guide: the approximately 10 ms upper-state lifetime of the ⁴I₁₃/₂ metastable level means the erbium population inversion cannot respond fast enough to track power fluctuations in any individual channel, so the gain seen by each channel is effectively decoupled from the others — a single EDFA amplifies all wavelength channels simultaneously without cross-gain modulation corrupting adjacent channels.
This is the fundamental reason EDFAs are preferred over semiconductor optical amplifiers for multi-channel WDM amplification: SOAs have carrier lifetimes orders of magnitude shorter, making them susceptible to the cross-gain modulation that the erbium ion's slow upper-state dynamics naturally suppress.
With the three configuration types fully mapped and their system-level consequences understood, the picture of EDFA architecture as a design discipline is complete — and the natural next step is to draw those threads together into the broader framework of link budget planning and system design that the preceding sections have been building toward.
Conclusion
From Block Diagram to System-Level Design
Every element in an EDFA block diagram occupies its position for a reason — and those reasons are not independent of one another.
Pump wavelength, pumping geometry, isolator placement, and configuration type interact: each decision shapes the constraints on the next.
Reading the diagram fluently means reading those interactions — and that is the foundation for whatever comes next: cascaded system planning, gain flattening, link budget selection.
Frequently Asked Questions About EDFA Technology
Precise answers to common questions about erbium-doped fibre amplifier technology, architecture, and applications in optical networks.
An EDFA (erbium-doped fibre amplifier) is an all-optical amplifier that boosts light signals in the 1530–1565 nm C-band by passing them through a short length of silica fibre whose core is doped with trivalent erbium ions (Er³⁺), pumped by a laser diode at 980 nm or 1480 nm. Critically, the signal is never converted to an electrical form — amplification occurs entirely in the optical domain. The C-band gain window coincides with the lowest-loss transmission window of silica fibre, which is the fundamental reason EDFAs became the dominant amplification technology for long-haul optical communications. In practical transmission systems, EDFAs are deployed periodically along a fibre link to compensate for the attenuation that accumulates over each span — typically every 60 to 80 km in terrestrial long-haul networks — restoring signal power without electrical regeneration. They are used as booster amplifiers at the transmitter output, in-line amplifiers along the route, and pre-amplifiers ahead of the receiver, each configuration placing different demands on gain, output power, and noise performance.
An EDFA works through stimulated emission in erbium-doped silica fibre. A pump laser diode operating at 980 nm or 1480 nm excites Er³⁺ ions from their ground state to a higher energy level; at 980 nm pumping, ions rapidly relax to the metastable ⁴I₁₃/₂ excited state within about 1 µs. Incoming signal photons at approximately 1550 nm then trigger those excited ions to drop to the ground state, emitting coherent photons at exactly the signal wavelength — producing optical gain. The metastable state has a spontaneous emission lifetime of roughly 10 ms, which is long enough for population inversion to build and sustain amplification across a broad bandwidth. An unavoidable by-product of this process is amplified spontaneous emission (ASE): ions that decay spontaneously rather than via stimulated emission emit broadband photons at ~1550 nm, contributing noise to the system. Optical isolators placed at the input and output of the amplifier suppress back-reflections that would otherwise destabilise the gain medium, while optical filters manage the ASE noise floor.
In a DWDM (dense wavelength division multiplexing) system, an EDFA simultaneously amplifies all wavelength channels in the C-band without demultiplexing them — a single amplifier boosts tens or hundreds of co-propagating channels at once. This is possible because the erbium gain medium responds to the total optical power rather than to individual channel modulation. The physical reason inter-channel interference is suppressed is the long upper-state lifetime of the Er³⁺ ⁴I₁₃/₂ metastable level (~10 ms), which is orders of magnitude longer than the bit periods of any practical data channel. Gain fluctuations caused by one channel's signal pattern cannot modulate the gain seen by other channels fast enough to cause crosstalk — a property described as negligible cross-gain modulation. The primary challenge in multi-channel DWDM deployments is gain non-uniformity across the C-band: the stimulated emission cross-section of erbium varies with wavelength, so different channels receive different gain. At low input powers, the gain peak near 1530–1535 nm can exceed the plateau between 1540–1560 nm by more than 10 dB. Across a cascade of amplifiers, this per-span error compounds — reaching around 10 dB of cumulative variation after 20 spans with static correction alone. Gain flattening filters (GFFs), typically inserted at the mid-stage of a dual-stage amplifier, are the standard architectural response, achieving spectral uniformity within ±0.5 dB across the C-band under fixed operating conditions.
EDFAs dominate long-haul fibre networks for three reasons: their gain window matches the lowest-loss transmission band of silica fibre (the C-band, 1530–1565 nm), they offer noise figures approaching the 3 dB quantum limit (practical devices typically achieve 4–6 dB), and they are inherently polarisation-insensitive due to the symmetrical nature of the fibre core. The long metastable lifetime (~10 ms) also suppresses inter-channel crosstalk in WDM systems, which is a decisive advantage at scale. Raman amplifiers take a fundamentally different approach: amplification occurs through stimulated Raman scattering distributed along the transmission fibre itself, rather than in a discrete doped-fibre stage. This distributed gain improves noise performance and allows amplification in spectral windows outside the C-band, including the S-band — making Raman amplification well-suited to ultra-long-haul and submarine links. The trade-off is significantly higher pump power: around 500 mW or more is required to produce useful gain in standard fibre, which has limited widespread commercial adoption. Raman amplifiers are most commonly deployed as distributed preamplifiers in hybrid configurations alongside EDFAs. Semiconductor optical amplifiers (SOAs) are electrically pumped, compact, and integrable into photonic integrated circuits, making them attractive for short-reach and on-chip applications. However, SOAs have faster gain dynamics — recovery times on the order of 200 ps — which makes cross-gain modulation between WDM channels a genuine concern, and their noise figures at the module level are typically higher than EDFAs due to fibre-to-waveguide coupling losses. Each amplifier class has a natural domain: EDFAs for long-haul C-band WDM, Raman for ultra-long-haul and extended-band coverage, SOAs for compact and integrated photonic applications.