

Introduction
If you are specifying an EDFA for a real system, you already know the basics — and what you actually need is a clearer picture of why the EDFA wavelength range behaves the way it does, and what that means for the decisions in front of you.
This guide is written for engineers past the primer stage: it covers the C-band and L-band gain windows, the pump wavelengths that drive them, gain profile characteristics across both bands, and the trade-offs that arise when selecting or specifying an amplifier for a real deployment.
The goal is practical: by the end, you should be able to treat wavelength range as a design variable rather than a fixed number, and reason confidently about when standard approaches serve you and when they do not.
TL;DR
EDFA wavelength range is not a single specification — it is a set of interacting engineering variables. Your choice of gain band, pump wavelength, and operating conditions shapes noise figure, gain flatness, and system capacity in ways that compound across a link.
Getting those choices right requires understanding the physics behind them, not just the numbers.
This article covers:

C-band and L-band gain windows and their origins
Pump wavelength trade-offs: 980 nm vs 1480 nm
Gain profile flatness and how engineers manage it
DWDM channel loading and gain bandwidth implications
Gain saturation effects on operating wavelength
Temperature effects and sub-band optimisation for specialist applications
What Is EDFA Wavelength Range?
Every EDFA operates in the 1.5 µm telecom window for a reason that traces back to the atomic structure of a single ion: Er³⁺. Understanding why erbium produces gain at these specific wavelengths — and not elsewhere — is the foundation for every engineering decision that follows, from C-band channel loading to L-band architecture choices.
Erbium's 4f Electrons and Host-Independent Emission
In a glass matrix, erbium forms trivalent ions with a [Xe]4f¹¹5s²5p⁶ electronic configuration, and all visible and infrared erbium transitions originate from electrons in the 4f electron shell.
Critically, the 4f layer is partially isolated from the surrounding glass by the outer 5s and 5p electron shells, which shield it from the local crystal field of the host material.
This shielding means erbium's absorption and emission spectra are relatively unaffected by the type of glass matrix used — silica, fluoride, or otherwise — which is precisely what made silica optical fibre a viable gain medium without requiring a purpose-built host.
The ⁴I₁₃/₂ → ⁴I₁₅/₂ Transition: Origin of C-Band Gain
The physical origin of EDFA gain is a single radiative transition: the decay of Er³⁺ from the ⁴I₁₃/₂ metastable upper state to the ⁴I₁₅/₂ ground state.
The energy gap of this ⁴I₁₃/₂ → ⁴I₁₅/₂ transition corresponds to photon emission around 1.53–1.55 µm, placing the primary gain window squarely in the C-band (1530–1565 nm).
This is not a tunable or engineered outcome — the transition energy is a fixed property of the Er³⁺ ion, which is why the C-band gain window sits where it does and cannot be relocated by changing host chemistry alone.
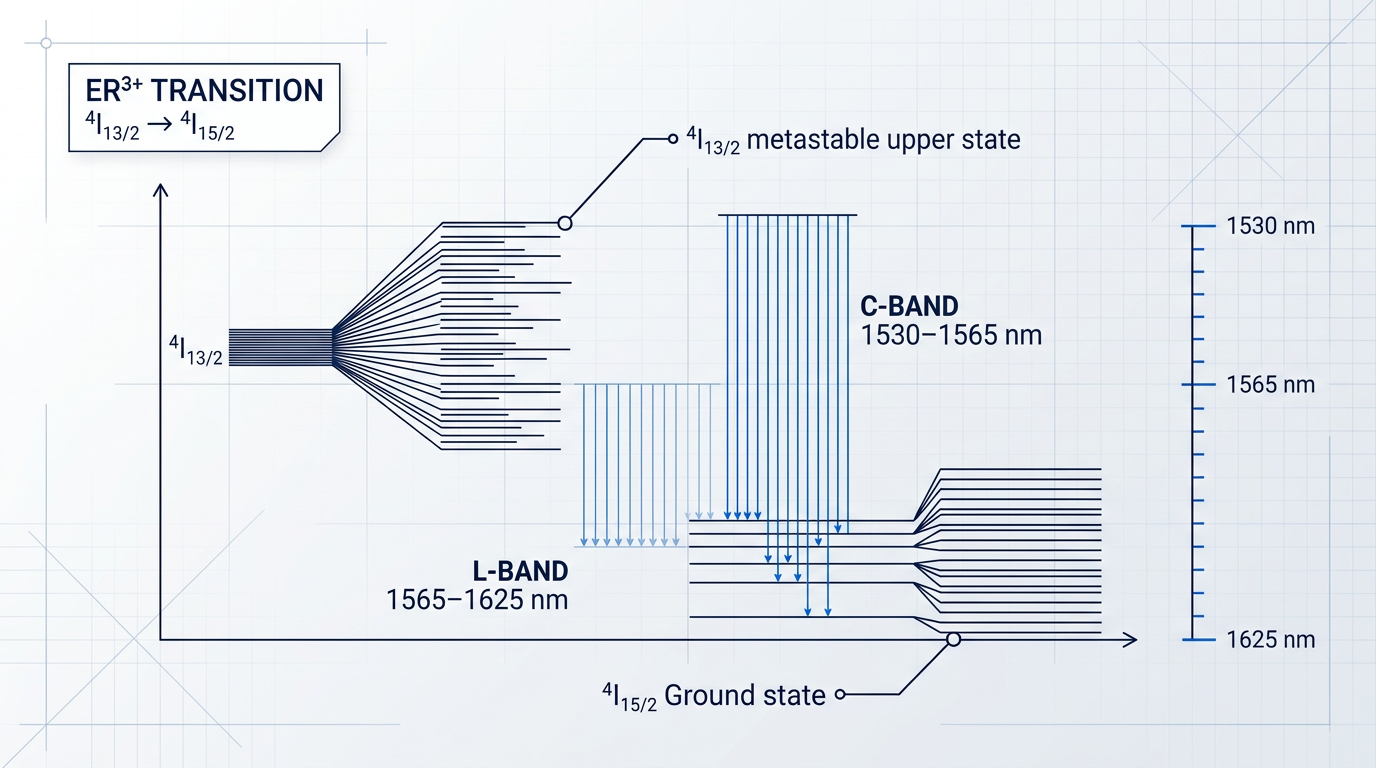
The diagram above illustrates why the EDFA gain window is tied to this specific transition: pump absorption populates the ⁴I₁₃/₂ state, and signal photons in the 1530–1565 nm range stimulate coherent emission back to the ground state.
Stark Splitting: From Atomic Line to 35 nm Gain Window
A bare two-level transition would produce gain at a single wavelength, not across a useful optical bandwidth.
What transforms the ⁴I₁₃/₂ → ⁴I₁₅/₂ transition into a broad, continuous gain spectrum is Stark splitting: when Er³⁺ ions are incorporated into silica glass, each discrete energy level fragments into multiple sublevels under the influence of local electric fields in the glass matrix.
Because silica is amorphous rather than crystalline, each Er³⁺ ion experiences a slightly different local crystal field environment, producing a slightly different pattern of Stark shifts — a phenomenon known as inhomogeneous broadening.
Viewed across the ensemble of ions, the result is that each discrete energy level disperses into a continuous energy band, and the aggregate gain spectrum spans a broad, continuous range rather than a sharp line.
The C-band gain bandwidth of roughly 35 nm — wide enough to carry dozens of DWDM channels — is not an intrinsic property of the erbium transition. It is a consequence of Stark splitting in the amorphous silica host, where each ion's subtly different local environment collectively broadens a single atomic line into a usable optical window.
The gain spectrum that results is not flat — its shape and peak location vary with the distribution of Stark-split sublevels and with the thermal population of those sublevels — a point that becomes central when engineering gain uniformity across DWDM channels.
Upper-State Lifetime and WDM Crosstalk Suppression
The ⁴I₁₃/₂ state is metastable, with a carrier lifetime on the order of milliseconds in silica-based erbium-doped fibre — several orders of magnitude longer than the bit periods of optical signals in modern communications systems.
Because the gain medium cannot respond on the timescale of individual bits or packet-level power fluctuations, it effectively averages over the total signal power across all channels, suppressing inter-channel crosstalk in WDM systems.
This property is not incidental — it is one of the defining reasons the ⁴I₁₃/₂ → ⁴I₁₅/₂ transition is so well suited to multi-wavelength amplification, and it is a direct consequence of the same atomic physics that determines the gain wavelength.
Alignment with Silica Fibre's Minimum-Loss Window
The erbium gain window sitting at 1.5 µm coincides with the minimum-loss window of silica optical fibre, where attenuation reaches its lowest point — a value of 0.2 dB/km was demonstrated near 1550 nm as early as 1979, as documented in ITU-T historical records.
Contemporary single-mode fibre such as Corning SMF-28 Ultra specifies a maximum attenuation of 0.18 dB/km at 1550 nm, confirming that the C-band sits at the heart of the fibre's lowest-loss region.
This overlap between the erbium gain window and the fibre transmission minimum was not engineered — it is a physical coincidence that engineers recognised and exploited, and it is what made EDFAs the enabling technology for long-haul DWDM rather than a laboratory curiosity.
The L-Band: Same Transition, Different Conditions
The L-band (1565–1625 nm) arises from the same ⁴I₁₃/₂ → ⁴I₁₅/₂ transition, accessed at lower population inversion levels and with longer lengths of erbium-doped fibre — conditions that shift amplification toward the longer-wavelength, lower-gain-cross-section end of the Stark-split manifold.
The L-band is not a separate physical phenomenon; it is the same transition operating at a different point on the gain spectrum, which is why both bands can be addressed within a single amplifier architecture when the operating conditions are appropriately controlled.
With the physical origin of the EDFA wavelength range established, the next step is to examine what the C-band gain profile actually looks like in engineering terms — how it varies across 1530–1565 nm, where its peaks and troughs fall, and what that non-uniformity means for DWDM system design.
The C-Band (1530–1565 nm): Gain Profile and DWDM Dominance
The C-band is the amplification standard for long-haul DWDM — but its gain profile is not the flat, uniform window it is often assumed to be, and treating it as such is the first engineering mistake a system designer can make.
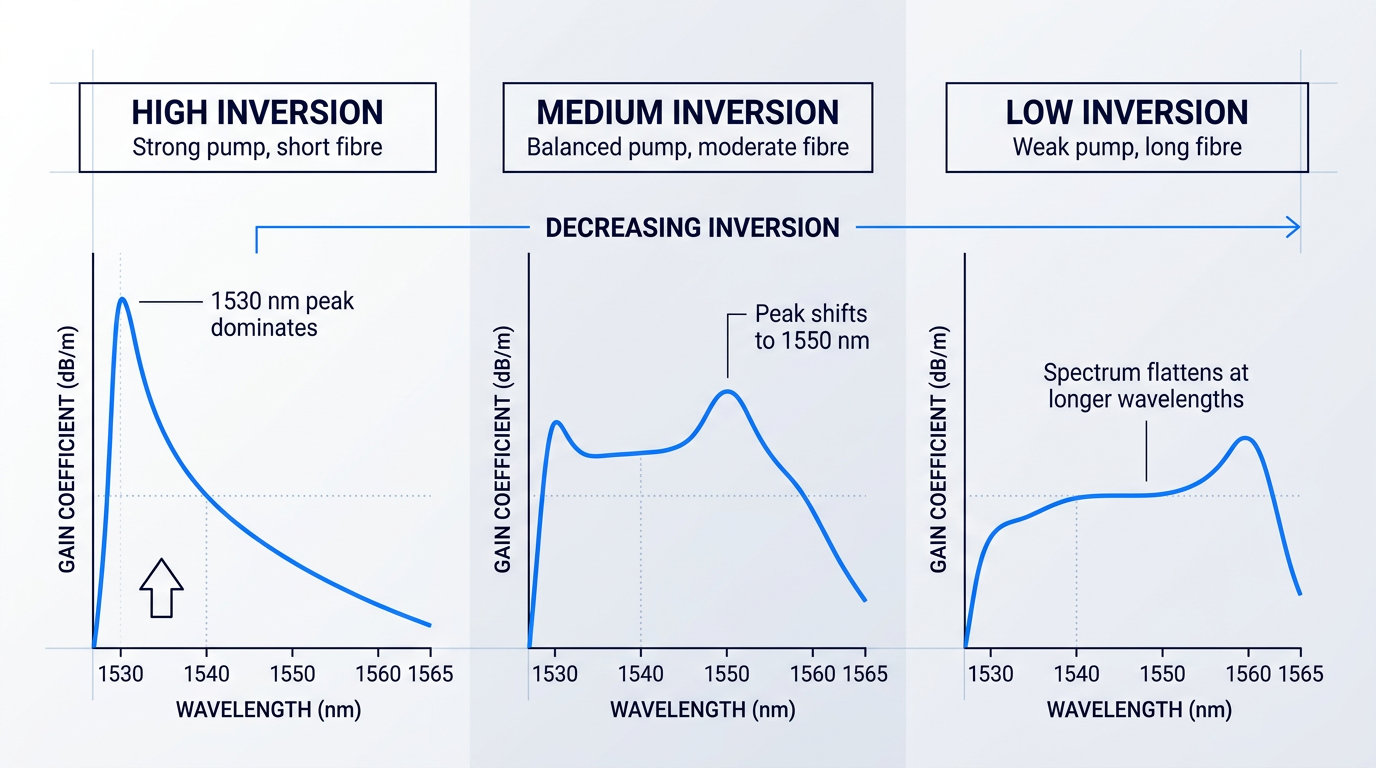
Across the 1530–1565 nm window, the natural erbium gain spectrum exhibits a pronounced peak near 1530 nm and a broader, relatively flatter region between approximately 1540 and 1560 nm — and these two features are not equal in height.
Critically, their relative prominence is not fixed: it is governed by the inversion level of the erbium-doped fibre at any given operating point.
At high inversion — driven by strong pump power with a short fibre length — the short-wavelength peak near 1530 nm dominates, producing the highest gain coefficient at that end of the band.
As inversion decreases, the relative gain at shorter wavelengths falls faster than at longer wavelengths, shifting the effective gain peak toward the 1550 nm region; at an appropriately chosen average inversion, the gain can be made quite flat across the longer-wavelength portion of the C-band.
This is the mechanism behind what is sometimes called dynamic gain tilt: with increasing signal power, inversion is suppressed, and the gain spectrum tilts toward longer wavelengths while the 1530 nm peak is progressively reduced.
The physical origin of this non-uniform, inversion-dependent profile traces directly to the Stark-split sublevels of both the ⁴I₁₃/₂ and ⁴I₁₅/₂ manifolds — those sublevels produce a gain spectrum whose shape is determined by the thermal population distribution across them, which shifts as the inversion level changes.
Fibre Composition as a Gain-Shaping Tool
Inversion management is not the only lever available for shaping the C-band gain profile — fibre composition is an equally powerful, and often underappreciated, first-order design variable.
Aluminium co-doping broadens and flattens the gain spectrum in the 1545–1560 nm range compared to germanium or phosphorus co-doping, and most commercial EDFAs today use Al-codoped fibres specifically for this reason — their wider, smoother gain spectra are better suited to multi-channel DWDM operation.
The mechanism is structural: aluminium alters the local crystal field environment around the Er³⁺ ions, producing a different distribution of Stark-split sublevel energies and therefore a broader gain spectrum more amenable to flattening across the longer-wavelength portion of the C-band.
Alternative host glass compositions — including fluoride-based and tellurite-based matrices — have been shown to produce broader emission bandwidths and different spectral shapes compared to standard silica, offering additional degrees of freedom when the design objective targets a specific sub-band within the C-band.
The practical consequence is that an amplifier designer working on a sub-band application can use host glass selection as a gain-shaping degree of freedom before reaching for filters or inversion management — a perspective that separates amplifier design from amplifier selection.
The location of the C-band gain peak shifts with inversion: high inversion favours the 1530 nm peak; lower inversion shifts gain toward 1550 nm. Combined with co-dopant and host glass selection, this means the gain profile is an engineering variable — not a fixed property of erbium.
Why C-Band Anchors Standard DWDM Systems
The C-band's dominance in DWDM deployments is the product of several converging factors, none of which alone would be sufficient — but together they make C-band the unambiguous engineering baseline for long-haul optical transmission.
- Fibre loss alignment: The 1530–1565 nm window coincides with silica fibre's minimum-loss region, so amplified signals travel the longest possible spans before requiring regeneration.
- ITU-T G.694.1 frequency grid: The DWDM grid is anchored at 193.1 THz with fixed channel spacings of 12.5, 25, 50, and 100 GHz — all defined within the C-band operating window.
- Channel capacity: The 35 nm C-band supports around 40 channels at 100 GHz spacing, rising to approximately 80 channels at 50 GHz spacing on the same ITU grid.
- Mature component ecosystem: Pump lasers, WDM couplers, isolators, and gain-flattening filters have all been developed and optimised specifically around C-band operating wavelengths over decades.
The component ecosystem point deserves emphasis: the maturity of C-band infrastructure is self-reinforcing — because the ecosystem is deep, system designers default to C-band; because designers default to C-band, the ecosystem deepens further.
C-band dominance is therefore as much an ecosystem effect as a physics-driven outcome — which is precisely why departing from it (as L-band operation requires) demands a deliberate engineering justification rather than a simple wavelength substitution.
Against this backdrop, small-signal gains of 20–40 dB and saturation output powers of 20 dBm or more in booster configurations are the performance figures that made C-band EDFAs the long-haul amplifier of choice — high-power booster designs have demonstrated output powers up to 27 dBm using advanced pump architectures.
Understanding C-band operation at this level of depth — gain profile shape, inversion dependence, co-dopant effects, and ecosystem context — is the foundation for evaluating when the same erbium transition, pushed into a lower-inversion operating regime with longer fibre lengths, becomes the L-band: the subject of the next section.
The L-Band (1565–1625 nm): Gain Characteristics and Engineering Contexts
The L-band does not arise from a different physical mechanism than the C-band — it arises from the same ⁴I₁₃/₂ → ⁴I₁₅/₂ erbium transition, operating under a fundamentally different set of conditions. That single fact reframes everything: the L-band is not a separate amplification technology grafted onto EDFA design, but a distinct operating regime accessed by controlling how hard the erbium population is driven.
As established in the C-band section, population inversion level shapes the gain spectrum. At high inversion, the 1530 nm peak dominates. As inversion falls, gain at shorter wavelengths collapses first, and the gain window shifts toward longer wavelengths — into the 1570–1610 nm region that defines practical L-band operation. L-band amplifiers deliberately exploit this behaviour by running at low average inversion levels (around 40%), which minimises intrinsic gain ripple while pushing the gain window to longer wavelengths.
One direct consequence of operating at lower inversion is that maximum achievable gain in the L-band is smaller than at the C-band peak — the emission cross-sections in the L-band are substantially smaller than those for the C-band, so the gain coefficient per unit length of fibre is significantly reduced.
L-Band Gain Profile: Key Differences from C-Band
The L-band gain profile has a different spectral character from C-band. Where the C-band is dominated by a pronounced peak near 1530 nm that requires aggressive gain-flattening, the L-band gain ripple is approximately an order of magnitude smaller than C-band — Corning's prototype L-band amplifier demonstrated 1.4% gain ripple (0.35 dB per 25 dB of gain), compared to typical C-band ripple of 4–6%.
That smoother spectral shape has a practical payoff: L-band gain-flattening filters are easier to manufacture and introduce less insertion-loss penalty than their C-band equivalents, though gain flattening is still required for DWDM use.
The noise figure penalty is the parameter engineers most commonly underestimate when moving from C-band to L-band specifications. Because the longer EDF length accumulates more amplified spontaneous emission (ASE), and because backward ASE reduces inversion at the front end of the amplifier, L-band noise figures are characteristically worse than C-band — measured prototype data shows noise figures in the range of 4.11–6.47 dB across the 1570–1610 nm window, with the noise figure approximately 1 dB above comparable C-band values.
| Parameter | C-Band | L-Band |
|---|---|---|
| Wavelength range (ITU-T) | 1530–1565 nm | 1565–1625 nm |
| Typical operating inversion | High (~80%+) | Low (~40%) |
| Peak gain region | ~1530 nm (high inversion) | ~1570–1610 nm |
| Gain ripple (typical) | 4–6% | ~1.4% (order of magnitude lower) |
| Noise figure vs. C-band | Baseline reference | ~1 dB higher than C-band |
| EDF length required | Baseline reference | ~4–5× longer than C-band |
| Emission cross-sections | Larger | Substantially smaller |
Side-by-side comparison of C-band and L-band EDFA characteristics across key engineering parameters, grounded in sourced figures.
The table makes the engineering trade-off explicit: the L-band's smoother gain profile and lower ripple come at the cost of longer fibre, higher noise figure, and reduced pump conversion efficiency — all of which are direct, predictable consequences of the lower inversion regime, not manufacturing defects or design failures.
The longer EDF length requirement is perhaps the most consequential practical difference. Because the smaller emission cross-sections in the L-band yield a significantly lower gain coefficient per metre, achieving useful gain requires erbium-doped fibre coil lengths approximately four to five times longer than what a comparable C-band amplifier needs, using standard fibre types.
That length difference translates directly into larger amplifier footprint, higher component count, and greater design complexity — which is why L-band amplifiers are more expensive to manufacture than C-band equivalents and why their architecture differs in a specific, well-understood way.
Two-Stage Architecture: Managing Noise Figure in L-Band
The standard approach to L-band amplifier design uses a two-stage cascaded structure: a short, high-inversion first stage followed by a longer, low-inversion second stage.
The logic is straightforward. Noise figure is dominated by what happens at the front end of an amplifier — a low-noise first stage, pumped at 980 nm to achieve high front-end inversion, sets a good noise figure baseline before signal power drops too low. The longer second stage then does the heavy lifting: operating at low inversion, it provides the gain at L-band wavelengths where the first stage has weak emission cross-sections, often using a 1480 nm pump to exploit the higher pump conversion efficiency available at that wavelength.
In wideband C+L designs, a band-splitting filter separates C and L channels before amplification, routing each into an independent, parallel amplifier path optimised for its respective band, then recombining them after. A short shared initial gain section with high inversion can precede the split, providing enough gain to overcome the passive component losses of the splitting filter itself.
When L-Band Is the Right Engineering Choice
The following contexts are not edge cases or workarounds — they are well-understood, actively deployed engineering scenarios where L-band amplification is the technically correct decision from the outset.
- Wavelength-exhausted C-band networks: When all C-band channels on an existing SMF link are occupied, adding L-band capacity doubles available spectrum without deploying new fibre — the dominant driver of L-band adoption in long-haul and metro networks.
- Dispersion-shifted fibre (DSF) infrastructure: On legacy DSF, C-band signals experience near-zero dispersion (~0.05 ps/km·nm at 1550 nm), making four-wave mixing a severe DWDM impairment. DSF dispersion rises to ~3 ps/km·nm at 1590 nm, suppressing FWM at L-band wavelengths.
- C+L combined architectures: Maximum-capacity long-haul systems run both bands in parallel via band-splitting filters, with each path independently optimised — enabling up to approximately 192 channels at 50 GHz spacing versus ~96 in C-band alone.
The spectrum quantum involved in the L-band decision is significant. The ITU-T defines the L-band as 1565–1625 nm — a 60 nm window that, converted to frequency, represents approximately 4.8 THz of additional spectrum, comparable in scale to the C-band itself. Exploited in a C+L architecture, that spectrum is not a marginal extension but a near-doubling of the available transmission window on existing fibre infrastructure.
The lower inversion regime that makes L-band gain possible is the same regime that raises dispersion on DSF to levels that suppress four-wave mixing. Choosing L-band for DSF infrastructure is not a compromise around C-band limitations — it is the operating condition that simultaneously enables amplification and eliminates the dominant nonlinear impairment.
With both the C-band and L-band signal windows now characterised — their gain origins, profile shapes, architectural requirements, and engineering contexts — the next question is what drives amplification across both regimes: the choice of pump wavelength and what that choice means for noise figure, efficiency, and amplifier design in practice.
Pump Wavelengths: 980 nm vs 1480 nm Trade-offs
Pump wavelength selection is one of the most consequential design decisions in an EDFA — not a background specification to inherit from a reference design. The choice between 980 nm and 1480 nm pumping determines noise figure, power conversion efficiency, gain per unit length, and whether remote deployment is physically feasible. Getting this decision right requires understanding why the two wavelengths behave differently at the ion level, not just what the performance numbers say.
Why the Two Pump Pathways Differ Fundamentally
The performance difference between 980 nm and 1480 nm pumping originates in the excitation pathway each wavelength follows through the Er³⁺ energy level structure.
At 980 nm, pump photons excite Er³⁺ ions from the ground state (⁴I₁₅/₂) to the short-lived ⁴I₁₁/₂ level, which has a lifetime of approximately 1 µs. From there, ions rapidly decay via a non-radiative multiphonon transition into the metastable ⁴I₁₃/₂ upper laser level, where they accumulate with a lifetime on the order of 10 ms.
Because the ⁴I₁₁/₂ level empties so quickly through non-radiative decay, pump photons at 980 nm cannot drive stimulated emission — the intermediate level simply does not persist long enough. This enables very high inversion levels, approaching complete population inversion, which is the physical origin of the low noise figure advantage.
At 1480 nm, pump photons excite ions directly into the upper Stark levels of the ⁴I₁₃/₂ metastable state — the same level that provides gain. Because the absorption and emission bands overlap at this wavelength, the pump itself can drive stimulated emission from the highly populated ⁴I₁₃/₂ level back to the ground state. This limits the maximum achievable inversion: complete population inversion is physically unachievable with 1480 nm pumping, placing an inherent floor on the minimum noise figure.
Noise Figure and Efficiency: The Core Trade-off
These excitation physics translate directly into measurable performance differences across several engineering axes.
| Parameter | 980 nm Pump | 1480 nm Pump |
|---|---|---|
| Minimum noise figure | <4 dB (approaching 3 dB quantum limit) | ~5.5 dB (inherent floor from incomplete inversion) |
| Typical noise figure range | 4–5 dB | Higher than 980 nm for equivalent gain |
| Optical conversion efficiency | ~35% | ~50% |
| Gain per unit EDF length | High (order of 10 dB/mW for short lengths) | Lower gain coefficient; longer optimal EDF length |
| Er absorption bandwidth in silica | Narrow: 976–984 nm (-3 dB) | Broad: >~1450 nm |
| Pump stabilisation requirement | FBG stabilisation typically required | Generally not required |
| Remote pumping suitability | Limited by higher fibre propagation loss | Preferred — lower loss over distance |
Side-by-side comparison of 980 nm and 1480 nm pump wavelengths across key engineering performance parameters, sourced from UCSB ECE228 lecture data and RP Photonics technical references.
The noise figure gap — roughly 1.5 dB or more between the two pump wavelengths — may appear modest in isolation, but its impact compounds across a cascaded amplifier chain. In a long-haul system with many amplifier spans, each amplifier's noise contribution accumulates, so a per-stage noise figure advantage of even 1 dB translates to a significantly better end-to-end optical signal-to-noise ratio.
The efficiency picture favours 1480 nm. Because 980 nm pump photons carry substantially more energy than 1480 nm photons, a larger fraction of that energy is lost as heat per signal photon generated — a larger quantum defect. The 1480 nm pump, with its photon energy much closer to the signal photon energy, converts pump power to signal gain more efficiently, achieving roughly 50% optical conversion efficiency versus approximately 35% for 980 nm.
For EDF length, the two wavelengths diverge in a way that connects directly to the L-band discussion in the preceding section. Gain per unit length strongly favours 980 nm for short EDF configurations, where the high inversion level it creates produces rapid gain build-up. For longer EDF lengths — as required in L-band amplifiers — the better power conversion efficiency of 1480 nm can yield comparable or greater total gain, which is one reason 1480 nm pumping is commonly found in L-band designs.
Counter-propagating 980 nm pumping partially sacrifices the noise figure benefit because inversion at the signal input end — where noise is most sensitive — is lower than in the forward-pump case. Pump wavelength and pump direction are a coupled decision, not independent choices.
Application Mapping: Preamplifier, Booster, and Remote
Translating these physics into application guidance requires treating pump wavelength and pumping direction as a coupled decision. The UCSB ECE228 course materials confirm that co-propagating pump configuration produces a lower noise figure than counter-propagating, while bidirectional pumping achieves the highest gain values.
- Preamplifier (980 nm, co-propagating): Receiver-side stage where signal power is low and noise figure is the dominant concern. Co-propagating 980 nm maximises inversion at the signal input end, minimising noise.
- Booster amplifier (1480 nm, counter-propagating): Transmitter-side stage where output power is the priority. Counter-propagating 1480 nm optimises output power, with noise figure already set by an upstream preamplifier.
- Bidirectional pumping: Co- and counter-propagating pumps used simultaneously for maximum gain. Trades pump source complexity for extended operating range and highest output power.
- Remote pumping (1480 nm): Submarine repeaters and remotely pumped amplifiers where pump must travel significant distance. Lower propagation loss at 1480 nm makes this the only practical choice.
The canonical two-stage EDFA architecture — a 980 nm co-pumped first stage followed by a 1480 nm counter-pumped second stage — reflects this application logic directly: the first stage minimises noise figure, the second stage maximises output power, and a mid-stage access point (for dispersion compensation or gain flattening) sits between them.
Deployment Realities: Fibre Loss and Stabilisation
Two practical engineering considerations often override the theoretical preference for 980 nm in real deployments: fibre propagation loss at pump wavelengths and pump diode wavelength stabilisation.
Because Rayleigh scattering scales with the inverse fourth power of wavelength, 980 nm pump light experiences significantly higher attenuation in silica fibre than 1480 nm pump light. For locally pumped amplifiers in a terrestrial rack, this difference is inconsequential. For remotely pumped configurations — where pump light must travel tens of kilometres from the terminal to a submerged or remote EDF — it becomes decisive. RP Photonics confirms that a long distributed erbium amplifier should be pumped around 1.45–1.48 µm rather than 980 nm precisely for this reason, and Lightwave Online reporting on repeaterless submarine links documents the use of 1480 nm pump energy launched from the receiver terminal to reach passive EDF blocks up to ~100 km away.
On the stabilisation side, the erbium absorption band in silica is narrow at 980 nm — approximately 976 to 984 nm at the -3 dB points. Small wavelength drifts in the pump laser diode, caused by temperature or drive current variation, can shift the pump outside this window and meaningfully degrade amplifier performance. Fibre Bragg grating (FBG) stabilisation of the pump diode is therefore standard practice in high-performance 980 nm-pumped designs, adding component count and cost.
At 1480 nm, the erbium absorption band is substantially broader — the -3 dB bandwidth extends well below 1450 nm. This generally eliminates the wavelength stabilisation requirement, simplifying pump diode specification and reducing system complexity. As Lightwave Online notes, the flatter erbium absorption spectrum around 1480 nm generally eliminates the need for wavelength stabilisation, while 980 nm pumps for complex EDFAs must incorporate external FBG stabilisation to avoid the effects of even small wavelength changes.
The practical implication is that the noise figure advantage of 980 nm carries an engineering overhead — FBG stabilisation, tighter thermal management of the pump diode — that 1480 nm avoids. For metropolitan or central-office environments where power consumption and component count are tightly constrained, this overhead matters alongside the noise figure benefit.
The pump wavelength and pumping direction choices made here do not operate in isolation from the amplifier's spectral behaviour. Both determine the inversion level achieved along the EDF, and inversion level is the primary variable governing the shape of the erbium gain profile — specifically, how much the gain spectrum deviates from flat across the signal band. That challenge of gain profile flatness is the subject of the next section.
Custom EDFAs Engineered for Your Wavelength Requirements
Pump architecture, gain band, and noise figure targets vary by application. Our tailored EDFA designs are built around your specific operating wavelength range and system constraints.

Gain Profile Flatness Across the Operating Band
Pass a multi-channel DWDM signal through a single EDFA and the non-uniform erbium gain spectrum is a nuisance. Pass it through a chain of twenty amplifiers and that nuisance becomes a system-level crisis: channels sitting at the 1530 nm gain peak accumulate power stage after stage, while channels in the lower-gain regions of the C-band fall progressively further behind, until the power differential between channels is large enough to corrupt signal integrity across the entire link.
The gain variation across the untreated C-band can reach several dB — at low input powers, the difference between the 1530–1535 nm gain peak and the 1540–1560 nm plateau can exceed 10 dB. Correcting this is not optional in a DWDM system; it is a prerequisite for operating one.
The primary engineering response is the gain-flattening filter (GFF): a passive optical filter whose transmission profile is the inverse of the EDFA's gain spectrum, attenuating the higher-gain wavelengths to bring channel powers into alignment across the band.
The improvement a well-designed GFF delivers is substantial. At the nominal operating point of -10 dBm input power, gain variation across the 1525–1560 nm range can be reduced from approximately 3 dB to under 0.5 dB — a correction that makes the difference between a system that works and one that cannot be cascaded.
Where the GFF sits within the amplifier architecture matters as much as its spectral design. Placing it at the amplifier input imposes loss before the signal is amplified, adding directly to the noise figure — a 1–2 dB input loss produces a 1–2 dB noise figure penalty. Placing it at the output wastes output power at the point where any fractional loss is most costly in absolute terms.
The optimal position is the interstage location: between the first and second gain stages of a two-stage amplifier. Here, the GFF also attenuates backward-propagating amplified spontaneous emission (ASE) at the 1532 nm peak, which would otherwise saturate the first stage and degrade its noise figure. Interstage placement reduces backward ASE, raises the effective inversion in the first stage, and avoids the output power penalty of post-amplifier filtering — three gains from a single placement decision.
In-Fibre Gain Equalisation: Long-Period Gratings and Co-Dopants
An alternative to discrete filter components is the long-period grating (LPG), an in-fibre structure that achieves spectrally selective attenuation by coupling light from the guided core mode into co-propagating cladding modes at specific resonance wavelengths.
Because cladding modes are lossy, power transferred at the resonance wavelength is effectively removed from the signal path, creating a transmission attenuation band. The resonance wavelength is set by the grating period — typically tens to hundreds of micrometres for LPGs — and the coupling strength is controlled by the refractive index modulation depth. By engineering both parameters, the attenuation profile can be shaped to match the inverse of the EDFA gain spectrum.
LPGs are particularly well suited to all-fibre amplifier designs: they integrate directly into the fibre path without discrete bulk or thin-film components, exhibit low insertion loss, and are polarisation-independent — properties that make them attractive where component count and back-reflection are design constraints.
Before any filter is applied, the gain spectrum can be pre-shaped at the fibre design stage through co-dopant selection. Aluminium co-doping of the erbium-doped silica fibre produces a broader and flatter gain spectrum in the 1545–1560 nm range than germanium or phosphorus co-doping — aluminium modifies the local crystal field environment around the Er³⁺ ions, broadening the distribution of Stark-split sub-levels and smoothing the gain profile. Fluoride glass hosts yield a different spectral shape, with flatter gain in the 1532–1542 nm region.
Co-dopant choice is a first-order design variable, not a background specification. Selecting the right host composition reduces the peak-to-trough variation that the GFF must correct, easing its insertion loss burden and improving the overall noise figure budget.
Inversion Level, Gain Tilt, and the GFF Limitation
As established in the C-band section, the gain spectrum of an EDFA is not a fixed curve — its shape changes with the average inversion level of the erbium ions. At a well-chosen inversion, the gain spectrum in the 1550 nm region is naturally relatively flat; operating above or below that level distorts the profile, producing non-uniformity that a GFF designed for the nominal inversion state cannot fully compensate.
This coupling between inversion and filter performance defines a fundamental constraint: the GFF is designed for one specific operating point, and the amplifier must be operated to maintain that inversion state for the filter to do its job correctly.
The practical consequence becomes acute in deployed DWDM systems. If channel loading changes — channels are added or dropped, input power varies — the inversion level shifts, the gain spectrum shape changes, and the GFF no longer compensates correctly. The result is gain tilt: a wavelength-dependent gradient across the gain profile that the static filter cannot track.
A gain-flattening filter that achieves under 0.5 dB gain variation at its nominal operating point will not remain flat when channel loading changes. As channels are added or dropped in a ROADM network, inversion level shifts, the gain spectrum shape changes, and gain tilt emerges — an operational reality in reconfigurable DWDM systems, not a laboratory edge case.
This is not a flaw that undermines gain-flattening technology; it is a system design constraint that separates thoughtful amplifier engineering from naive design. In reconfigurable optical add-drop multiplexer (ROADM) networks, where channel loading varies continuously with traffic patterns, the amplifier design must account for the dynamic range over which the gain spectrum will shift — and the acceptable gain tilt budget must be specified as an operational parameter, not just a static figure.
The gain tilt problem under varying channel loading is the direct bridge to the next discussion: how channel count and loading interact with the usable gain bandwidth of an EDFA, and what that means for system designers working with dense channel plans across the C- or L-band EDFA wavelength range.
DWDM Channel Loading and Gain Bandwidth
A single EDFA simultaneously amplifying 96 channels across the C-band is not a convenience feature — it is the architectural fact that made long-haul DWDM economically viable at scale. The amplifier's gain bandwidth is not a soft guideline for system designers; it is the hard ceiling on how many channels can be carried, because any channel that falls outside the gain window receives inadequate amplification and the link fails.
From Gain Bandwidth to Channel Count
As established in the C-band and L-band sections of this guide, each band offers approximately 4.8 THz of usable gain spectrum. The ITU-T G.694.1 frequency grid, anchored at 193.1 THz (1552.52 nm), defines how that spectrum is partitioned into discrete channels at fixed spacings of 12.5, 25, 50, and 100 GHz — or at flexible slot widths in multiples of 12.5 GHz granularity.
The arithmetic is direct: dividing the usable band width by the chosen channel spacing gives the maximum channel count the amplifier can serve at that grid density.
| Channel Spacing | C-Band Channels (~4.8 THz) | L-Band Channels (~4.8 THz) | Combined C+L Channels |
|---|---|---|---|
| 100 GHz | ~48 | ~48 | ~96 |
| 50 GHz | ~96 | ~96 | ~192 |
| 25 GHz | ~192 | ~192 | ~384 |
| 12.5 GHz | ~384 | ~384 | ~768 |
Shows how EDFA gain bandwidth translates to channel count at each ITU-T G.694.1 spacing for C-band and L-band, making the capacity ceiling concrete for system designers.
The ITU-T handbook notes approximately 40 channels at 100 GHz spacing across the C-band, with the number doubling at 50 GHz — consistent with the ~4.8 THz usable bandwidth figure; the values above are derived arithmetically from that bandwidth using the G.694.1 grid spacings.
The practical implication for system designers is that grid selection is inseparable from amplifier specification: moving from 100 GHz to 50 GHz spacing doubles capacity, but only if the gain profile is flat enough across the full occupied spectral range to deliver uniform gain to every channel in the comb — which is why the gain flatness work discussed in the preceding section is a prerequisite, not an optional refinement.
The flexible grid, introduced in the 2012 revision of G.694.1 and refined in the 2020 edition, allows slot widths to be tailored to modulation format and baud rate — but the amplifier must still cover the full occupied spectral range, regardless of how that range is partitioned.
A single EDFA boosts every channel within its gain window simultaneously. Adding channels within the gain bandwidth adds zero amplifiers — the economic engine of DWDM is the amplifier's spectral width, not its per-channel power.
C+L Band Architecture: Doubling Capacity on Existing Fibre
Adding the L-band to a C-band network doubles the available channel count without laying new cable — a compelling economic argument for carriers operating over leased dark fibre on regional or long-haul routes, where a second fibre pair can be prohibitively expensive.
The physical structure of a C+L band amplifier site reflects the fact that C-band and L-band cannot share a single EDFA chain: a C-band amplifier has negligible gain in the L-band, and an L-band amplifier absorbs C-band signals rather than amplifying them.
- Band-splitting filters: At each amplifier site, a passive filter separates the composite WDM signal into C-band and L-band paths before amplification.
- Parallel independent EDFA chains: Each band is amplified by its own chain, independently optimised for the correct EDF length, inversion level, and gain profile.
- Band recombination: After amplification, C-band and L-band outputs are recombined by a second passive coupler and relaunched onto the transmission fibre.
- Per-band dispersion compensation: Because C- and L-band channels accumulate chromatic dispersion at different rates, each band can be compensated independently within its amplifier chain.
The independence of the two amplifier chains is not an implementation detail — it is the reason C+L systems can achieve genuinely double capacity rather than a degraded approximation of it. Attempting to amplify both bands through a single chain optimised for one band yields suboptimal performance in the other, eroding the capacity gain that justified the architecture.
Stimulated Raman Scattering in C+L Systems
Operating signals across both the C-band and L-band simultaneously introduces a nonlinear impairment that does not arise in single-band systems at the same severity: Stimulated Raman Scattering (SRS) in the transmission fibre.
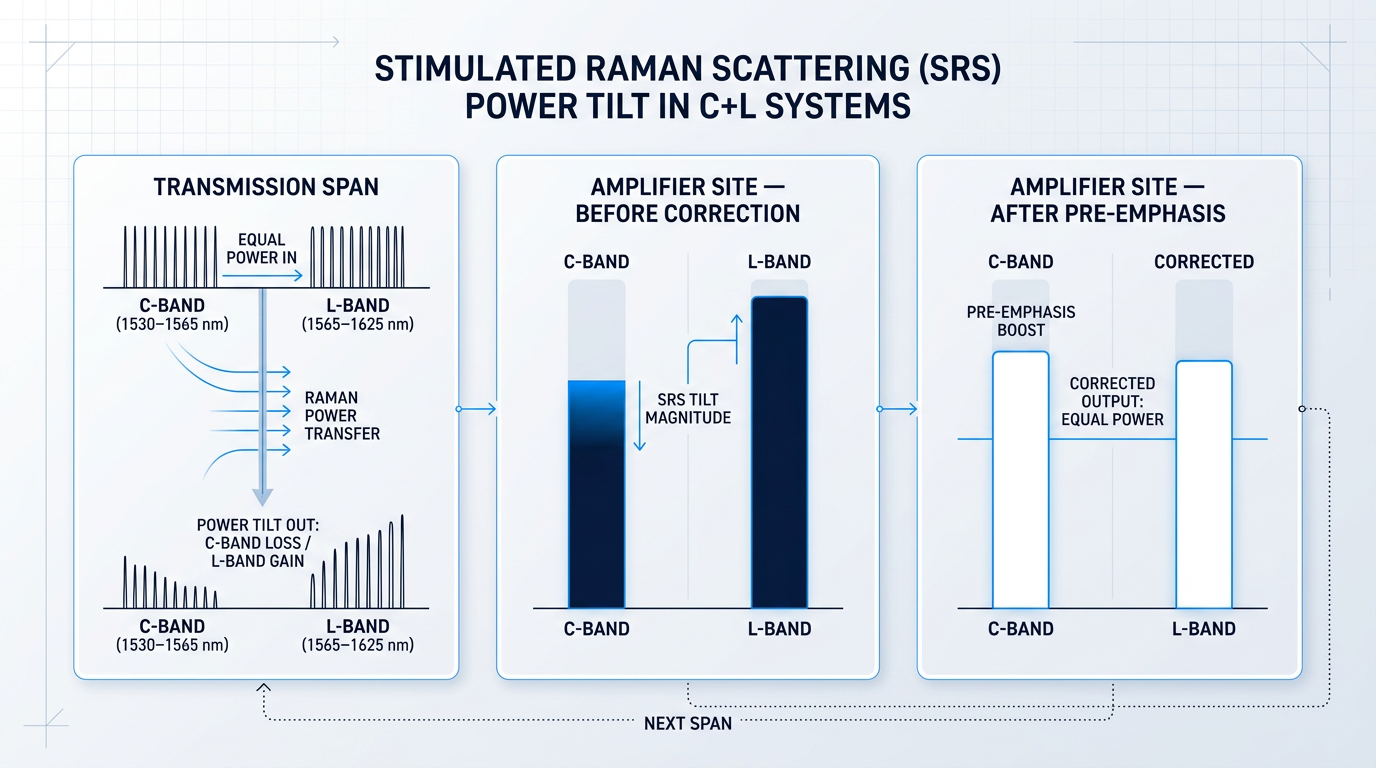
The mechanism is a power transfer within the fibre itself: shorter-wavelength channels (C-band) act as inadvertent pump sources for longer-wavelength channels (L-band), transferring optical power from higher to lower frequencies via the Raman effect in the glass medium. The result is a progressive spectral tilt — C-band channels lose power, L-band channels gain power — that accumulates span by span.
This is not a theoretical concern to be noted and filed away. IEEE research on ultra-wideband transmission identifies SRS as the dominant inter-band impairment in C+L scenarios, causing the main variation in generalised signal-to-noise ratio degradation across the combined spectrum. The tilt must be actively corrected at each amplifier site, or channel performance diverges progressively across the link.
Two management approaches are standard in deployed C+L systems. The first is pre-emphasis: launch powers are adjusted — at the transmitter or at each amplifier site — so that after the SRS tilt has acted across a span, all channels arrive at the next amplifier site with approximately equal power. This requires accurate prediction of the SRS tilt magnitude as a function of channel loading and spectral distribution.
The second approach is ASE noise loading of unoccupied spectral slots: broadband ASE noise is injected into unused channels across both bands, so the amplifier chain always sees a spectrally full load regardless of how many live traffic channels are present. Because SRS tilt magnitude depends on the total power and spectral distribution of all signals in the fibre, a consistently filled spectrum produces a consistent, predictable tilt — one that can be corrected with static compensation rather than dynamic algorithms that must adapt as channels are added or removed.
Both approaches work in practice, and they are not mutually exclusive. ASE noise loading simplifies the power management problem by making the SRS tilt constant; pre-emphasis then corrects that constant tilt. The key engineering point is that neither approach eliminates SRS — they manage its consequences, and system designers specifying C+L amplifier chains must account for both the correction mechanism and the margin it consumes.
Gain Bandwidth as a Strategic Capacity Ceiling
As coherent DSP technology matures and approaches the Shannon limit for spectral efficiency per channel, the per-channel capacity lever progressively closes. The primary remaining mechanism for growing total fibre throughput is expanding the spectral window over which signals are amplified.
This reframes the EDFA wavelength range as a strategic network parameter, not a component specification. The choice of whether to operate C-band only, add L-band, or consider further band extensions determines the capacity ceiling of the entire optical network built on that fibre infrastructure — a decision with consequences that extend well beyond the amplifier room.
The conventional C+L configuration — 4.8 THz per band, 9.6 THz combined — doubles fibre capacity relative to C-band alone and represents the current industry consensus for cost-effective capacity expansion on existing fibre assets. Extending further into wider bands introduces noise and ripple penalties that can offset the additional spectrum, making the conventional C+L window the most efficient architecture for most deployment contexts today.
Understanding how many channels an EDFA can serve is only part of the capacity picture, however. The next consideration is what happens to the gain profile itself when those channels are fully loaded — specifically, how high aggregate input power drives gain saturation and shifts the wavelength of peak gain, which is the subject of the next section.
Gain Saturation and Its Effect on Operating Wavelength
Gain saturation is not simply a power ceiling — it is an operating condition that actively reshapes the EDFA gain spectrum, shifting the effective peak-gain wavelength and invalidating gain-flattening assumptions designed for small-signal operation.
The mechanism traces directly to the ⁴I₁₃/₂ metastable upper-state population established by the pump. When a strong input signal — or the aggregate power of multiple WDM channels — drives stimulated emission faster than the pump can replenish the excited-state population, the stored energy in the gain medium is depleted and inversion level falls.
Because the shape of the erbium gain spectrum is a function of inversion level, that fall has a direct spectral consequence: as inversion decreases under saturation, the pronounced gain peak near 1530 nm is suppressed, and the gain profile tilts toward the longer-wavelength region around 1550–1560 nm within the C-band.
ScienceDirect's reference data on EDFA gain spectra confirms this behaviour explicitly: as signal optical power increases, the gain tilts toward the longer wavelength side and the short-wavelength peak around 1530 nm is suppressed — a direct consequence of the reduced inversion driving the quasi-three-level transition.
A GFF designed for small-signal, high-inversion operation does not remain correctly compensating when the amplifier is driven into saturation — the gain profile it was built to flatten has shifted, leaving residual tilt that compounds across cascaded amplifier stages.
This is the critical implication for deployed systems: the gain-flattening filter optimised for one inversion level does not remain flat when the inversion changes, as ScienceDirect's gain spectrum analysis notes — passive gain flattening is effective only at one particular operating condition of the amplifier.
Saturation Power, Saturation Energy, and Operating Regime
Engineers characterise gain saturation through two distinct parameters, and the choice of which governs a given application is determined by the signal's temporal character — not by the amplifier alone.
- Saturation power (P_sat): The steady-state signal power at which gain drops to half its small-signal value. Governs CW and continuous multi-channel DWDM systems.
- Saturation energy (E_sat): The pulse energy at which gain falls to approximately 37% (1/e) of its initial value. Governs pulsed amplification regimes.
RP Photonics defines these parameters precisely: saturation power applies to steady-state operation and is the signal power halving the small-signal gain, while saturation energy is the pulse energy reducing gain to 1/e of its initial value — and crucially, E_sat depends on the emission and absorption cross-sections and mode area, but not on the upper-state lifetime.
For erbium-doped fibre amplifiers specifically, the relatively small transition cross-sections mean the saturation energy is comparatively large — RP Photonics notes it is easily several microjoules even for small effective mode areas, and tens of microjoules for large mode area fibres.
A system designer must identify which metric governs their application before reasoning about saturation margins: a DWDM line amplifier operating continuously with 80 channels loaded is governed by P_sat; a pulsed fibre laser amplifier is governed by E_sat.
In multi-channel DWDM systems — the context established in the preceding section — it is the aggregate signal power across all active channels that drives the amplifier's saturation state, not any individual channel's power.
This creates a practical operational problem: channel add/drop events in a live DWDM network change the total power seen by the erbium-doped fibre, which shifts the saturation state, which shifts the gain profile experienced by all surviving channels.
Research on multichannel EDFA dynamics confirms that gain excursions in surviving channels result from cross-saturation effects when channels are dropped — and that in dynamically reconfigurable networks, these add/drop events occur on timescales comparable to the EDFA's gain dynamics, requiring active transient control.
The spectral consequence of this transient behaviour is not channel-specific hole burning, however. Erbium in silica glass is predominantly homogeneously broadened at room temperature, which means saturation compresses gain uniformly across all signal frequencies rather than carving deep spectral holes centred on individual channels.
The ScienceDirect comprehensive reference on EDFA physics states this directly: at room temperature, the gain saturates mostly homogeneously in an EDFA, because all Stark sub-levels are strongly coupled by fast thermalisation effects — a coupling that breaks down only at very low temperatures, where spectral hole burning becomes significant.
The SPIE Doped Fiber Devices proceedings confirm the practical consequence: the strongest signal saturates the gain medium and compresses gain uniformly at the expense of weaker signals — gain tilt rather than channel-specific holes, which simplifies dynamic gain equalisation design without eliminating the need for it.
Spectral hole burning does exist in erbium-doped silica at room temperature, but ScienceDirect's gain spectrum analysis notes it is even weaker than expected from extrapolated linewidth data, attributed to rapid thermal redistribution among the Stark-split sub-levels of the first excited state manifold.
Booster and Preamplifier Regimes: Different Saturation Environments
The saturation state of an amplifier is not an incidental operating detail — it defines the amplifier's role, and the two canonical roles in a transmission system occupy fundamentally different saturation regimes.
- Booster amplifier: Operates at high output power in the saturated regime. EDF length, GFF design, and pump wavelength — typically 1480 nm for power conversion efficiency — must all be optimised for the saturated operating point.
- Preamplifier: Operates at low input power in the small-signal regime. Inversion is high, the 1530 nm gain peak dominates, and noise figure is the primary design constraint — driving the preference for 980 nm pumping.
RP Photonics' fiber amplifier buyer guidance makes the design distinction explicit: preamplifiers are optimised for the lowest possible noise figure, while booster amplifiers prioritise saturated output power — and the noise figure of a booster, while higher, is not relevant in combination with a downstream preamplifier.
The consequence for amplifier specification is that the same EDF and GFF design cannot be optimal for both regimes: the saturation state fundamentally changes the inversion level, which changes the gain spectrum shape, which changes what the GFF must compensate for.
NIST SP 792 reinforces this point from a characterisation perspective — the gain of an EDFA depends on input signal, pump power, and fibre length, making it impossible to design an amplifier optimised for all operating conditions simultaneously, so the intended operating conditions must be considered from the outset.
Saturation is one of several operating-condition effects that shift the gain spectrum away from its small-signal character; temperature introduces its own spectral dependencies, and in real deployed systems both variables act simultaneously — the subject the next section addresses.
See Real EDFA Specifications for Your Wavelength Range
Gain saturation shifts performance in ways datasheets rarely capture at a glance. Download the EDF100 datasheet to validate specifications against your actual operating conditions and signal power requirements.
Temperature Effects and Sub-Band Optimisation
Datasheets describe an EDFA's gain profile at a single controlled reference point — standard laboratory conditions that deployed amplifiers rarely see. Outdoor cabinets, submarine line equipment, and industrial enclosures introduce a variable that most technical literature treats as a footnote: temperature.
How Temperature Shifts the Erbium Gain Profile
The mechanism is rooted in the same Stark-split manifold structure that defines the erbium gain spectrum. The ⁴I₁₃/₂ and ⁴I₁₅/₂ manifolds are each split into a ladder of sublevels, and the ensemble of individual sublevel transitions collectively produces the gain spectrum observed across the C- and L-band windows.
As temperature changes, the Boltzmann distribution across those sublevels shifts — redistributing population toward higher-energy sublevels at elevated temperatures and concentrating it toward the ground sublevel at lower temperatures.
Because different sublevels contribute differently to gain at different wavelengths, this redistribution produces a measurable change in the gain spectrum's shape: peak-gain wavelength shifts, gain ripple magnitude changes, and the relative depth of spectral troughs varies with operating temperature.
For a system whose gain-flattening filter was designed for a specific nominal operating temperature, a sustained thermal excursion of even a few tens of degrees introduces residual gain non-uniformity that the GFF cannot correct — because the GFF shape is fixed and the gain profile it was designed to flatten has moved.
This matters most in cascaded amplifier chains, where per-stage gain error accumulates across every span. An EDFA operating at elevated temperature in an outdoor enclosure will impose a different spectral tilt on each channel cluster than the same amplifier characterised under controlled laboratory conditions.
Engineers specifying amplifiers for thermally variable environments should request characterisation data across the intended operating temperature range and verify that GFF compensation remains within tolerance across that range — not only at the standard reference point used for datasheet measurements.
When the erbium gain profile shifts with temperature, a GFF shaped for one operating point cannot compensate for the new spectral contour. In cascaded systems, this per-stage error accumulates across every span — making thermal characterisation a system-level requirement, not just a component specification.
Sub-Band Optimisation: Engineering for a Specific Window
Not every application needs a full C-band or L-band amplifier. A system carrying a specific cluster of DWDM channels, a fibre sensing deployment at a fixed wavelength, or a network running on non-standard fibre can be better served by an amplifier engineered for a narrower sub-window than by a full-band design whose performance is spread across its entire span.
Sub-band optimisation trades unnecessary bandwidth for tighter gain flatness, lower noise figure, and higher efficiency within the target window — and it is a coherent design strategy, not a compromise.
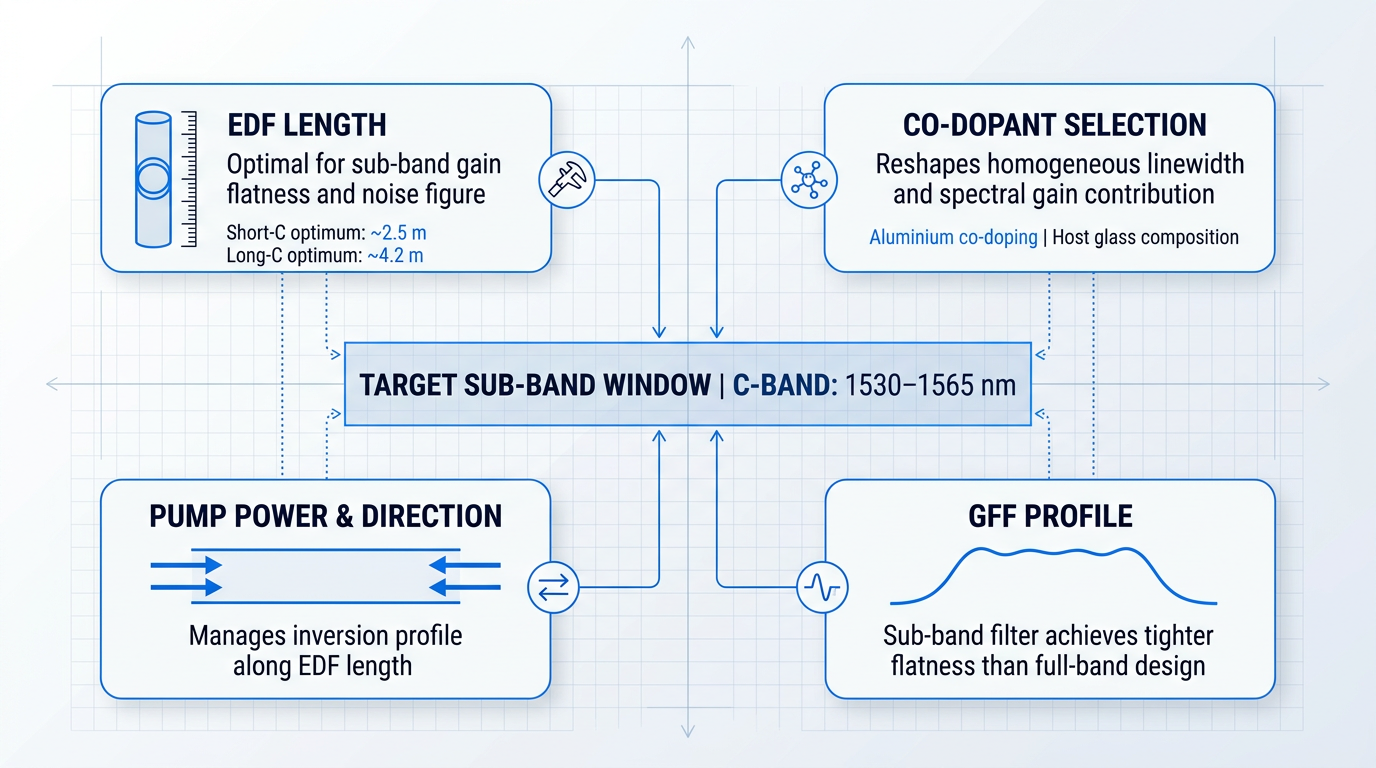
The available design variables form a coupled parameter space. EDF length, co-dopant selection, pump power, pumping direction, and GFF profile all interact, and each choice shifts the optimum of the others.
- EDF length: Optimal length for gain flatness and noise figure is wavelength-dependent; a length tuned for short-C performance is suboptimal for long-C or L-band operation.
- Co-dopant selection: Host glass composition and co-dopants such as aluminium reshape the homogeneous linewidth and the relative gain contribution at different sub-band wavelengths.
- Pump power and direction: Bidirectional pumping manages the inversion profile along the EDF length, enabling gain across a wider or differently weighted spectral window than single-end pumping.
- GFF profile: A filter shaped for a specific sub-band achieves tighter flatness within that window than a full-band GFF designed to span the entire C- or L-band gain contour.
The interdependence of these variables is what makes sub-band design non-trivial. An EDF length that produces the lowest noise figure at 1535 nm will drive the amplifier into a different inversion regime at 1555 nm — altering gain flatness and output power distribution in ways that require modelling rather than empirical iteration to resolve efficiently.
When deliberate design is applied, achievable wavelength coverage expands well beyond standard single-band configurations. Bidirectional pumping architectures allow the inversion profile along the EDF to be shaped such that gain is sustained simultaneously across both the C- and L-band regions — a capability unavailable to single-end pumped designs.
For applications requiring coverage beyond the standard silica fibre gain window, alternative host materials open further options. Crystalline hosts present different phonon environments and crystal field conditions that shift the Er³⁺ emission spectrum relative to silica glass, extending coverage toward wavelength regions inaccessible to conventional EDF designs regardless of pump configuration.
These extended-coverage configurations are engineering tools available to designers who have identified a genuine application requirement outside the standard window — not research curiosities, and not exotic departures from normal practice.
When an application sits outside standard C-band coverage, or demands gain flatness tighter than a full-band design can deliver within a specific sub-window, the appropriate response is a custom amplifier design scoped to those requirements from the outset — not an off-the-shelf amplifier whose performance envelope was defined for a different set of assumptions.
With the full picture of operating-condition effects and design-side responses now in view, the final step is translating that understanding into a specification decision matched to your specific application.
Conclusion
Choosing the Right Wavelength Range for Your EDFA Application
What this guide has really been describing is a single, coupled engineering problem: the EDFA wavelength range you operate in, the pump strategy you build around it, and the gain management approach you apply are not independent choices — each one shapes the constraints on the others.
For applications that fall outside standard C-band coverage, that interdependence is precisely why custom amplifier design exists — not as a last resort, but as the appropriate engineering response.
Frequently Asked Questions About EDFA Wavelength Range
Precise answers to the questions engineers and system designers ask most often about EDFA operating bands, gain characteristics, and DWDM channel capacity.
The 1530 nm gain peak is a consequence of inversion level. At high erbium inversion — when the upper-state (⁴I₁₃/₂) population is heavily pumped — the stimulated emission cross-section is largest at the short-wavelength end of the C-band, producing a pronounced peak near 1530 nm. As inversion decreases, whether through gain saturation, lower pump power, or a longer erbium-doped fibre, that peak shifts toward longer wavelengths within the C-band. The 1550 nm region is reached at moderate inversion levels, where the gain profile is flatter and more spectrally uniform across channels. This is why most DWDM systems are designed to operate around 1550 nm rather than 1530 nm: the gain is more stable, less sensitive to inversion fluctuations, and better suited to carrying many channels at equal power. The 1530 nm peak, by contrast, is sharper and more volatile — useful in some preamplifier contexts, but a liability in multi-channel systems where channel-to-channel gain uniformity is critical.
Not with a standard silica-hosted EDFA. The erbium gain window in conventional silica fibre spans roughly 1525–1620 nm, covering the C-band (1530–1565 nm) and L-band (1565–1625 nm). Signals outside this range cannot be meaningfully amplified by a standard design. Extending amplification beyond this window requires a change of either host material or rare-earth dopant. Fluoride glass hosts shift and broaden the erbium emission spectrum, and Er:YAG-based hosts can push gain toward the U-band (1625–1675 nm), though these are specialist designs rather than standard EDFA configurations. For the S-band (approximately 1450–1530 nm), thulium-doped fibre amplifiers (TDFAs) are the established technology. Praseodymium-doped amplifiers cover other windows further from the telecom C/L region. In short, if your signal sits outside 1525–1620 nm, a different amplifier architecture is required — the erbium gain physics in silica simply do not extend there.
Two factors govern channel count: the usable gain bandwidth of the amplifier and the channel spacing defined by the ITU-T G.694.1 frequency grid. A standard C-band EDFA covers approximately 4.8 THz of usable spectrum, which accommodates roughly 96 channels at 50 GHz spacing. Adding an L-band amplifier contributes another ~4.8 THz, bringing the combined total to approximately 192 channels across a C+L system. The architectural advantage that makes this economically compelling is that a single EDFA simultaneously amplifies all channels within its gain window — amplifier count does not scale with channel count. A 96-channel system requires the same number of amplifier stages as a 10-channel system using the same fibre span. This is the property that made long-haul DWDM viable at scale, and it is why gain bandwidth — not just gain magnitude — is the specification that drives system capacity planning.
In a DWDM (Dense Wavelength Division Multiplexing) system, an EDFA (Erbium-Doped Fibre Amplifier) is the optical amplification backbone. A single EDFA simultaneously boosts all optical channels within its gain window — typically the C-band (1530–1565 nm) or L-band (1565–1625 nm) — without converting signals to the electrical domain. This all-optical amplification is what makes multi-channel long-haul transmission economically practical: one amplifier serves dozens or hundreds of channels at once, rather than requiring a separate regenerator per channel. Before EDFAs became commercially available in the early 1990s, long-haul networks relied on electronic regenerators that had to detect, retime, and retransmit each wavelength individually. EDFAs eliminated that per-channel bottleneck, enabling the rapid scaling of DWDM capacity that underpins modern fibre networks. In a deployed system, EDFAs appear as in-line amplifiers at regular span intervals, as booster amplifiers at the transmit end, and as preamplifiers ahead of the receiver.
Standard C-band EDFAs deliver small-signal gains of 20–40 dB, with noise figures of 4–6 dB for high-quality designs. Booster configurations can achieve saturation output powers of 20 dBm or more. These figures are not fixed — they depend on several design variables. Pump wavelength is one: 980 nm pumping typically yields noise figures toward the lower end of the 4–6 dB range, while 1480 nm pumping tends toward the higher end due to the difference in achievable inversion levels. Erbium-doped fibre length also matters — longer EDF allows more pump absorption and higher gain, but at the cost of increased amplified spontaneous emission (ASE) if not carefully managed. Operating regime is the third key variable: preamplifiers prioritise low noise figure at modest gain, in-line amplifiers balance gain and noise over long spans, and booster amplifiers maximise output power. A well-specified EDFA datasheet will state gain, noise figure, and output power for a defined operating point rather than as single universal figures.