

Introduction
This guide is written for network engineers, photonics researchers, technical buyers, and students of optical communications who want a clear, reliable reference on the C-band and why it sits at the heart of modern fibre optic networks.
It takes you through the full picture: from the physics that make this particular wavelength window so well suited to long-distance transmission, through the amplification technology that made it practical, to the standards, deployment contexts, and capacity expansion strategies that shape how it is used today.
Where most available resources on this topic are either brief encyclopaedia stubs or narrow vendor summaries, this guide is structured to give you the depth and context that actually sticks.
TL;DR
The C-band's dominance in global optical networking is a direct consequence of physics: a remarkable alignment between silica fibre's minimum-loss point and the wavelength range at which erbium atoms amplify light. Once you understand that coincidence, everything else — the amplifier designs, the channel standards, the capacity roadmaps — follows naturally.
This article covers:

C-band low attenuation physics and long-haul suitability
How EDFAs exploit the C-band for all-optical amplification
DWDM channel plans and the ITU-T frequency grid
Extended and Super C-band variants and their significance
C-band deployment: long-haul, metro, and submarine
Chromatic dispersion in the C-band and its management
What is C Band Optical?
The C-band's dominance in global optical networking is not a historical accident — it traces directly to a specific window of physics that makes this 35 nm slice of the electromagnetic spectrum uniquely suited to long-distance transmission.
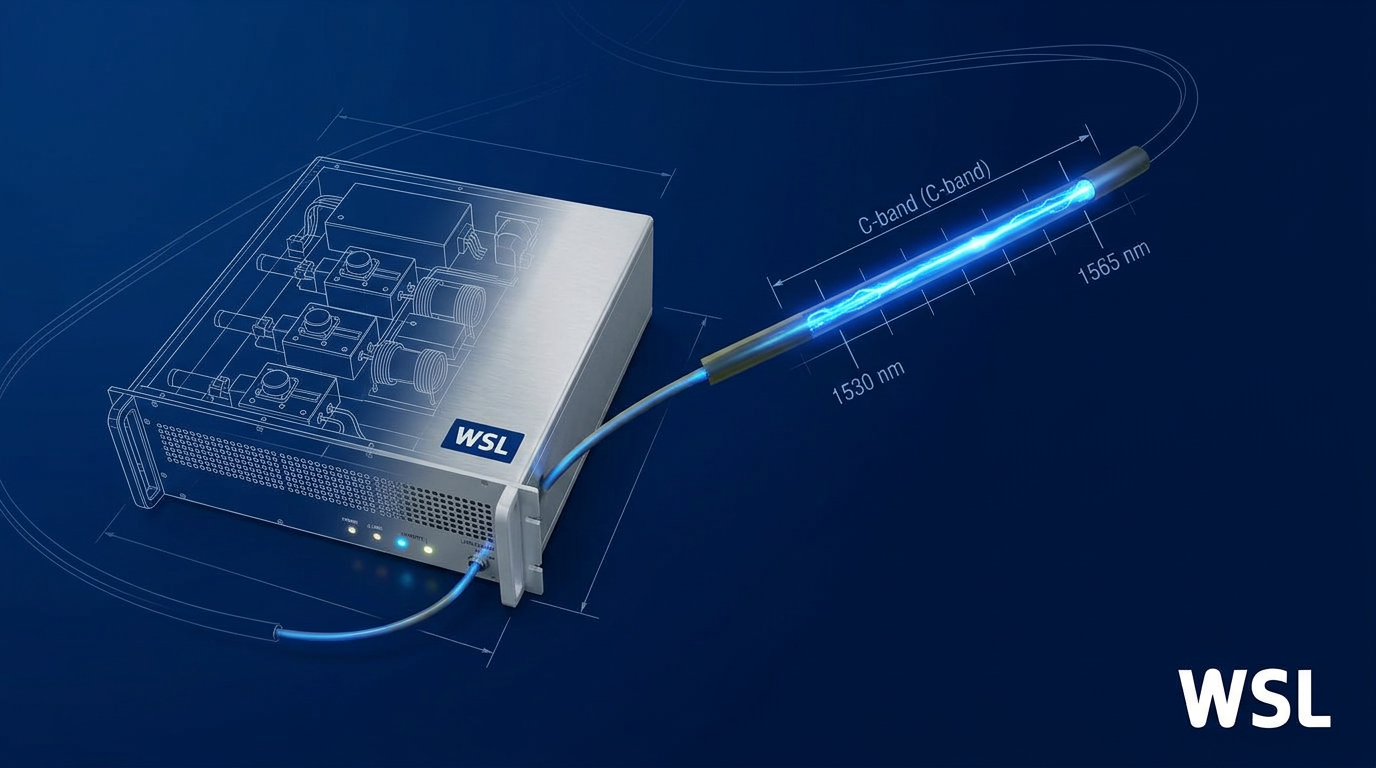
C band optical refers to the Conventional band, the wavelength range spanning 1530–1565 nm, as classified by the ITU-T in its G-series Recommendations and formally documented in G.Sup39 (Supplement 39 to the ITU-T G-series).
The letter "C" is simply an abbreviation for "Conventional" — the formal ITU-T descriptor for this band, which distinguishes it from the five other single-mode spectral bands in the ITU-T hierarchy.
The boundaries of the C-band are not administratively arbitrary. As G.Sup39 explains, early erbium-doped fibre amplifiers (EDFAs) exhibited useful stimulated emission gain beginning at approximately 1530 nm and tapering off at approximately 1565 nm — and this gain band had become known as the "C-band" before the boundaries were formally adopted.
In other words, the ITU-T drew the band boundaries around the EDFA gain window, not the other way around. The physical behaviour of erbium ions in silica glass defined the range; the standard formalised it.
The ITU-T Single-Mode Spectral Band Hierarchy
The C-band sits fourth in a six-band classification that ITU-T G.Sup39 defines for all single-mode fibre systems, spanning 1260 nm to 1675 nm in total.
| Band | Full Name | Wavelength Range | Primary Use Case |
|---|---|---|---|
| O-band | Original | 1260–1360 nm | Legacy single-mode systems, Ethernet, passive optical networks (PON) |
| E-band | Extended | 1360–1460 nm | Historically limited by OH absorption peak; now accessible via low-water-peak fibre |
| S-band | Short wavelength | 1460–1530 nm | Emerging capacity band; Raman-amplified systems, still maturing commercially |
| C-band | Conventional | 1530–1565 nm | Dominant long-haul DWDM and submarine transmission; EDFA gain window |
| L-band | Long wavelength | 1565–1625 nm | Capacity expansion beyond C-band; deployed in C+L wideband systems |
| U-band | Ultra-long wavelength | 1625–1675 nm | Maintenance and specialist use only; traffic-bearing transmission not foreseen |
ITU-T G.Sup39 six-band single-mode spectral classification, showing band letter, full name, wavelength range, and primary use case for each band.
Across the six bands, the C-band occupies a narrow but exceptionally productive position — just 35 nm wide, yet the foundation on which virtually all long-haul DWDM infrastructure is built.
One important precision point: as G.Sup39 itself states, "the definition of spectral bands is to facilitate discussion and is not for specification." The band table above is a classification framework, not a system specification.
Actual operating wavelength ranges for deployed equipment are defined in individual ITU-T Recommendations — for example, G.694.1 governs the DWDM frequency grid used within the C-band and L-band.
This is the spectral resource on which the entire DWDM channel plan is constructed. At 100 GHz channel spacing (0.8 nm per channel), that bandwidth supports a substantial number of independent data channels — all within a single fibre, amplified without optical-electrical-optical conversion.
The C-band's 35 nm spectral width corresponds to approximately 4.4 THz of optical bandwidth — a figure confirmed across ITU-T G.Sup42 and IEEE research literature, and the foundational number from which DWDM channel capacity is calculated.
Two properties set the C-band apart from every other band in the hierarchy: silica fibre reaches its minimum attenuation near 1550 nm, squarely within the C-band, and erbium-doped fibre amplifiers provide all-optical gain across precisely this window.
Understanding why these two properties converge in the C-band — and what that means for long-distance transmission — begins with the physics of how silica fibre loses light.
Why the C Band Has the Lowest Fibre Attenuation
The answer to why 1550 nm became the backbone of global optical communications lies not in engineering preference but in the fundamental physics of silica glass — two competing loss mechanisms that converge at their lowest combined value precisely within the C-band window.
The attenuation of light in silica fibre is strongly wavelength-dependent. It is high at short wavelengths, falls steadily through the near-infrared, reaches a minimum near 1550 nm, and then rises again as wavelengths extend into the mid-infrared — tracing a characteristic curve whose lowest point defines the most efficient transmission window available in silica glass.
Rayleigh Scattering and Infrared Absorption
Rayleigh scattering is the dominant loss mechanism at shorter wavelengths. It arises from microscopic density and compositional fluctuations that are frozen permanently into the glass structure as the silica solidifies during manufacture — a consequence of the amorphous nature of glass, not a defect that improved fabrication can eliminate.
The critical physical relationship is an inverse fourth-power dependence on wavelength: αR ∝ 1/λ⁴, confirmed by the DTU PhD thesis on silica fibre losses and consistent across the major textbook treatments. This means scattering loss falls sharply as wavelength increases — attenuation at 850 nm is far higher than at 1310 nm, and it continues to fall as wavelength climbs toward 1550 nm.
Infrared absorption provides the counterbalancing mechanism. Molecular vibrations of the Si-O bonds in silica produce strong intrinsic absorption bands in the mid-infrared, centred well beyond 7 µm, but the tails of these bands extend into the near-infrared and create a rising loss contribution above roughly 1600 nm — a limit that is equally intrinsic to silica and cannot be engineered away in a silica-glass fibre.
The 1550 nm loss minimum is the point where these two mechanisms sum to their lowest combined value: Rayleigh scattering, still falling with increasing wavelength, and infrared absorption, beginning to rise, cross at a trough that falls near 1550 nm for standard silica single-mode fibre. Standard SMF achieves a typical attenuation of approximately 0.2 dB/km at this minimum; ultra-low-loss pure-silica-core fibre variants have pushed this below 0.15 dB/km, with research fibres demonstrating values as low as 0.148–0.159 dB/km.
The 1550 nm loss minimum is an intrinsic property of silica glass: the crossover of Rayleigh scattering (falling as λ⁻⁴) and infrared Si-O bond absorption (rising with wavelength) produces a trough near 1550 nm that no silica-based fibre can avoid or relocate.
A third, historically significant loss mechanism sits between the O-band and the C-band: the OH absorption peak near 1383 nm, caused by residual hydroxyl ions from water absorbed into the glass during manufacture. This peak — not intrinsic to silica but present in older fibres — was large enough to render the E-band (1360–1460 nm) essentially unusable for early transmission systems. Modern low-water-peak fibres conforming to ITU-T G.652.C and G.652.D have reduced the 1383 nm attenuation to no more than 0.40 dB/km, opening the E-band for CWDM and wideband applications.
The table below places the C-band's loss advantage in quantitative context across the principal wavelength windows, using figures drawn from ITU-T G.652, the Optical Fiber Telecommunications IV-A textbook, and the Keiser reference.
| Wavelength | Band / Window | Typical Attenuation (SMF) | Primary Loss Mechanism |
|---|---|---|---|
| 850 nm | First window (multimode) | ~2–3 dB/km | Rayleigh scattering (dominant) |
| 1310 nm | O-band | ~0.32–0.40 dB/km | Rayleigh scattering (falling) |
| 1383 nm | OH peak (E-band boundary) | Can exceed 1 dB/km (standard fibre); ≤0.40 dB/km (G.652.C/D LWP) | OH ion absorption |
| 1550 nm | C-band | ~0.16–0.20 dB/km; <0.15 dB/km (ultra-low-loss) | Rayleigh scattering + IR absorption tail (combined minimum) |
| 1625 nm | L-band upper edge | ~0.20–0.35 dB/km | IR absorption tail (rising) |
Comparison of typical fibre attenuation across key wavelength windows to quantify the C-band loss advantage over other transmission windows
The contrast between the O-band and C-band figures carries direct engineering consequences. At 1310 nm, a link designer works with roughly double the loss per kilometre compared to 1550 nm — which translates to substantially shorter unamplified spans, more frequent amplifier sites, and higher infrastructure cost for any given route length.
ITU-T G.652 (both the 2009 and 2024 editions) codifies this difference explicitly: the typical installed link attenuation coefficient used in system planning is 0.275 dB/km for the C-band (1530–1565 nm) against 0.55 dB/km for the O-band (1260–1360 nm) — a factor of two that directly determines target distances and amplifier spacing in long-haul system design.
One additional property of the 1530–1565 nm window is relevant for readers who will encounter c band optical technology in sensing, LiDAR, or free-space applications: wavelengths above approximately 1400 nm are strongly absorbed by the cornea and anterior ocular media before reaching the retina, making the C-band inherently less hazardous to the retina than shorter-wavelength alternatives such as 1064 nm Nd:YAG.
With the physics of the loss minimum established, the natural next question is how this window is exploited for optical amplification — and why erbium turns out to be the almost improbably well-matched gain medium for it.
Erbium-Doped Fibre Amplifiers and the C Band Gain Window
Low attenuation in the 1530–1565 nm window was a necessary condition for long-haul optical transmission — but it was not sufficient on its own. Signals still needed amplification after every span of fibre, and for decades that meant converting them to electrical form, regenerating them, and converting them back. The technology that broke that constraint, and in doing so made the C-band the undisputed centre of global optical networking, was the erbium-doped fibre amplifier (EDFA).
An EDFA works by splicing a short length of silica fibre doped with trivalent erbium ions (Er³⁺) into the transmission path, then injecting light from a pump laser — typically at 980 nm or 1450 nm — into the same fibre.
The pump photons excite Er³⁺ ions from their ground state up to the ⁴I₁₃/₂ metastable energy level. When an incoming signal photon in the 1530–1565 nm range arrives, it triggers stimulated emission: the excited ion releases a coherent photon at exactly the same wavelength, phase, and direction as the signal photon, producing net optical gain without any conversion to electrical form.
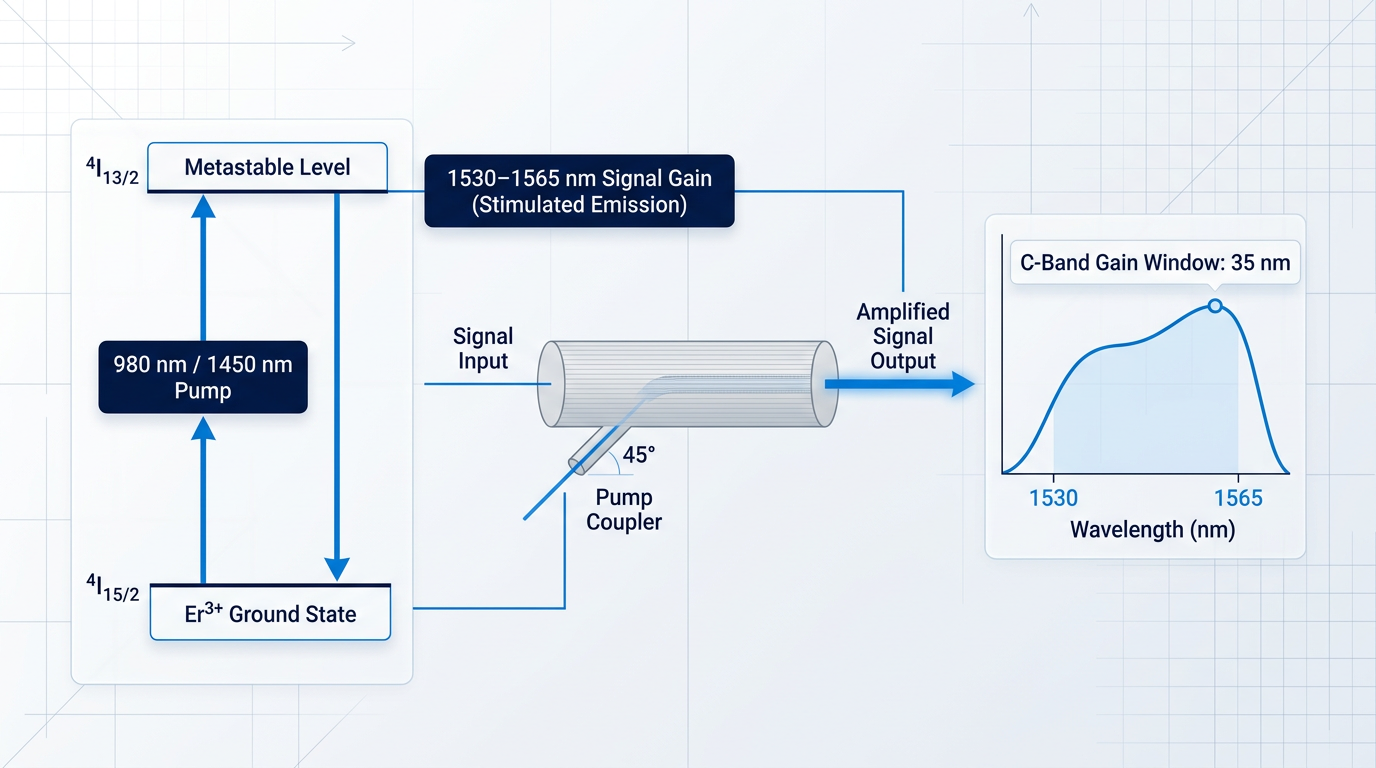
The critical fact is that erbium's emission band in silica glass spans approximately 35 nm, running from 1530 nm to 1565 nm — the precise boundaries of the C-band as defined by ITU-T, and the same spectral region where silica fibre reaches its minimum loss of around 0.2 dB/km.
Erbium's natural gain window in silica glass (1530–1565 nm) coincides exactly with silica fibre's minimum-loss window. That alignment — two independent physical properties converging on the same 35 nm band — is the reason the C-band became the foundation of long-haul optical networking. No standards body engineered this coincidence; physics delivered it.
Before EDFAs, network operators relied on OEO conversion (optical-electrical-optical) regenerators: the signal was detected, converted to an electrical bitstream, re-timed and reshaped, then re-transmitted as a new optical signal. This process was expensive, format-specific, and introduced latency at every regeneration point.
EDFAs amplify entirely in the optical domain, making them transparent to modulation format and bit rate — a 10 Gbit/s signal and a 400 Gbit/s coherent signal pass through the same amplifier without modification, which is why EDFA-based networks could absorb successive generations of transceiver technology without replacing the amplifier infrastructure.
A further property makes EDFAs particularly well-suited to multi-channel systems: the ⁴I₁₃/₂ metastable level has an upper-state lifetime measured in milliseconds, which is orders of magnitude longer than the timescale of individual channel fluctuations in a WDM signal. The gain medium simply cannot respond fast enough to individual channel variations, which suppresses cross-gain modulation and makes EDFAs inherently compatible with dense wavelength-division multiplexed traffic across the full C-band simultaneously.
EDFA Performance Parameters
| Parameter | Typical Value | Notes |
|---|---|---|
| Small-signal gain | 20–40 dB | Sufficient to recover one full fibre span of loss (~0.2 dB/km over 80–100 km) in a single compact stage. |
| Saturation output power (booster) | 17–23 dBm | Determines the launch power into the first fibre span; higher values extend reach between regeneration points. |
| Noise figure (practical) | 4–6 dB | Close to the 3 dB quantum (shot-noise) limit; sets the OSNR floor for each amplifier stage in a cascaded chain. |
Typical EDFA performance envelope across key parameters, giving engineers concrete figures for system planning.
The gain range of 20–40 dB means a single EDFA can recover the accumulated loss of a full 80–100 km fibre span in a device that fits in a rack unit — a capability that fundamentally changed the economics of long-haul network design.
The practical noise figure of 4–6 dB is close to the 3 dB quantum limit, which means there is limited headroom for further improvement; in cascaded chains of many amplifiers, even this small excess noise accumulates and sets the ceiling on optical signal-to-noise ratio (OSNR) — the dominant constraint on system reach and channel capacity.
The mechanism behind that OSNR ceiling is amplified spontaneous emission (ASE): excited erbium ions emit photons spontaneously in random directions and at random phases, and a fraction of this noise light is guided by the fibre and amplified by subsequent stages just as signal photons are. In long-haul systems with tens of amplifier spans, ASE accumulates linearly with the number of stages and is the primary factor driving careful OSNR budgeting in DWDM system design.
EDFA Roles in an Optical Network
- Booster amplifier: Placed immediately after the transmitter to maximise launch power into the first fibre span, extending reach before the first in-line stage.
- In-line amplifier: Positioned between successive fibre spans to compensate accumulated loss, maintaining signal power across the full transmission distance.
- Pre-amplifier: Installed directly before the receiver to lift the incoming signal above the receiver's sensitivity threshold, improving detection margin.
This three-role taxonomy — booster amplifier, in-line amplifier, and pre-amplifier — is standard across the industry and maps directly onto the architecture of any long-haul or metro optical system; the deployment contexts in which each role appears are covered in detail later in this guide.
The same erbium-doped fibre platform can also be extended to the L-band (1565–1625 nm) by operating the amplifier at a lower population inversion level, which shifts the gain peak toward longer wavelengths. This is the physical basis for C+L systems, which are discussed in the capacity expansion section of this guide.
For engineers specifying an EDFA for a real system, our Custom EDFA is a concrete example of how this technology is implemented at the application level. Built on a MOPA (master oscillator power amplifier) architecture and operating across 1530–1625 nm, it covers both C-band and L-band from a single source through one cable — useful for operators planning for C+L expansion without a second amplifier platform.
What distinguishes it from catalogue alternatives is the depth of engineering behind each unit: every parameter — operating band, output power, pulse regime, pulse energy and peak power, cooling configuration, form factor, and control firmware — is configured to the specific application, up to the highest commercially available power levels for erbium fibre (pulse energies above 10 mJ, peak powers above 100 kW, average powers above 100 W). Many suppliers in this market are resellers or importers rather than manufacturers, which limits their ability to support or modify the product; Woodrow Scientific designs, builds, qualifies, and supports its amplifiers entirely in-house, on patented technology, with fibre-amplifier expertise rooted in Southampton's Optoelectronics Research Centre — the institution where the EDFA was first developed.
The amplifier carries CE and UKCA certification, offers air- or water-cooling options, operates at the eye-safer 1550 nm wavelength (with reduced-hazard-zone builds available), and is supported by direct engineering access throughout integration — the full specification is configured per project.
With the amplification technology established — the gain mechanism, the performance envelope, and the network roles EDFAs occupy — the natural next question is how the C-band's 35 nm of EDFA-amplified bandwidth is structured into discrete transmission channels, which is exactly what the DWDM channel plans and ITU-T grid section covers next.
Custom EDFAs Built for C-Band Systems
EDFAs are the technology that made C-band long-haul transmission practical. We design and build tailored EDFAs for a wide range of optical communications applications — explore our custom solutions.

DWDM Channel Plans and the ITU-T Grid
The C-band's substantial optical bandwidth is an extraordinary physical resource — but raw bandwidth alone cannot carry traffic. Dense Wavelength Division Multiplexing (DWDM) is the technique that converts this continuous optical window into dozens of discrete, simultaneous channels, each carrying independent data streams on a single fibre.
ITU-T G.694.1 is the international standard that imposes order on this resource, defining the DWDM frequency grid that all compliant systems share. Its anchor point is 193.1 THz (approximately 1552.52 nm), from which all channel centre frequencies are calculated as integer multiples of the chosen channel spacing.
The grid did not arrive in its current form all at once. It began at 100 GHz channel spacing — the widest fixed spacing defined in G.694.1 — and was progressively subdivided as laser and optical filter technology matured to support tighter wavelength control.
Each successive revision halved the spacing: from 100 GHz to 50 GHz, then to 25 GHz, and finally to 12.5 GHz. Because each step is a factor-of-two subdivision of the previous, the spacings are powers-of-two multiples of one another — a deliberate structure that reflects the technology roadmap, not an arbitrary set of numbers.
| Channel Spacing | Approx. Channels (C-band) | System-level reference | Notes |
|---|---|---|---|
| 100 GHz | ~40 | G.959.1 specifies up to 40 channels | Earliest and widest fixed spacing; widest per-channel bandwidth tolerance |
| 50 GHz | ~80 | G.694.1 fixed grid | Doubles channel count vs. 100 GHz; mainstream for long-haul DWDM deployments |
| 25 GHz | ~160 | G.694.1 fixed grid; IEEE TechNav: more than 160 channels | Requires tighter laser and filter tolerances; supports higher aggregate capacity |
| 12.5 GHz | Derived: ~320 (factor-of-two extrapolation) | G.694.1 fixed grid | No direct source; practical deployment constrained by component tolerances — flexible grid often preferred at this density |
Comparison of ITU-T G.694.1 fixed channel spacings against approximate channel counts across the C-band, showing the scaling relationship and system-level context for each spacing.
The pattern in the table is straightforward: halving the channel spacing roughly doubles the number of usable channels across the C-band. At 100 GHz, ITU-T G.959.1 specifies up to 40 channels as a system-level parameter; moving to 50 GHz spacing pushes that figure to approximately 80 channels, and IEEE TechNav notes more than 160 channels become available at 25 GHz spacing.
The trade-off is not purely additive, however. Tighter channel spacing demands more precise lasers, narrower optical filters, and tighter wavelength stability across temperature and ageing — so the gain in channel count comes with increased component complexity and cost.
G.694.1's 2012 revision introduced a further evolution: the flexible DWDM grid, which allows frequency slots of variable width rather than constraining every channel to a uniform spacing.
The flexible grid is defined with a nominal central frequency granularity of 6.25 GHz and a slot width granularity of 12.5 GHz, enabling systems carrying mixed bit rates and modulation formats to allocate slot widths matched to each signal's actual spectral occupancy.
This flexibility is the foundation of elastic optical networking. Systems carrying 100 Gbit/s alongside 400 Gbit/s coherent channels, for example, no longer need to pad every signal into a fixed-width container — each channel occupies only the spectrum it requires.
The ITU-T G.694.1 grid exists so that a transmitter from one vendor, a multiplexer from a second, and a receiver from a third can all operate on the same channel plan without bilateral negotiation. Without this shared standard, the C-band would remain a physics window — it is standardisation that makes it a global, interoperable telecommunications infrastructure.
Two companion ITU-T Recommendations apply the G.694.1 grid to real deployed systems. ITU-T G.698.1 covers multichannel DWDM applications for metro networks and defines the C-band central frequency range as 191.5 THz to 196.2 THz — consistent with the 1530–1565 nm window established earlier in this guide.
ITU-T G.959.1, covering optical transport network physical layer interfaces, specifies the system-level channel parameters — including the 40-channel count at 100 GHz spacing — that give G.694.1's grid definitions their operational meaning in deployed networks.
The ITU-T grid defines the baseline channel plan for the standard C-band, but the industry has not stood still. The next section examines how commercial deployments have pushed beyond these boundaries, extending the usable window to capture additional channels through Extended and Super C-band variants.
Basic, Extended, and Super C Band Variants
The ITU-T's formal definition of the C-band is fixed at 1530–1565 nm — but commercial optical systems have never been bound by that boundary in practice, and the capacity gains from pushing beyond it are substantial.
The starting point is the Basic C-band: the original ITU-T-defined 1530–1565 nm window, which at 50 GHz channel spacing supports approximately 80 wavelengths per fibre pair — the long-standing historical standard from the mid-2000s.
The industry's first major extension was the Extended C-band, also referred to as C+, which expands the usable spectrum slightly beyond the formal boundary to accommodate 96 wavelengths at 50 GHz spacing — a 20% bandwidth improvement over the traditional 80-wavelength baseline.
The next step is the Super C-band (also described as the ultra-wide C-band in some industry literature), which pushes channel count to 120 wavelengths at 50 GHz spacing, representing the current commercial frontier of C-band capacity expansion.
| C-Band Variant | Channel Count (50 GHz spacing) | Throughput at 100 Gbps per wavelength |
|---|---|---|
| Basic C-band | ~80 wavelengths | 8 Tbps per fibre pair |
| Extended C-band (C+) | 96 wavelengths | 9.6 Tbps per fibre pair |
| Super C-band | 120 wavelengths | 12 Tbps per fibre pair |
Comparison of Basic, Extended, and Super C-band variants by channel count and aggregate throughput at 100 Gbps per wavelength
The progression from 80 to 96 to 120 wavelengths translates directly into fibre plant economics: moving from Basic to Extended C-band adds 1.6 Tbps of capacity per fibre pair; moving from Basic to Super C-band adds 4 Tbps — a 50% capacity increase over the original baseline, without laying new fibre or changing the underlying amplifier technology.
For network operators facing sustained traffic growth, this arithmetic is significant: each step up the C-band hierarchy defers the cost and complexity of L-band activation, extracting more revenue-bearing capacity from existing infrastructure.
Extended and Super C-band operation is not without engineering cost, however — wider operating bandwidth demands EDFAs with correspondingly wider and flatter gain profiles, making the gain-flattening filters (GFFs) introduced in amplifier design more demanding, since erbium's gain spectrum is not uniform across an extended window.
"Extended C-band", "C+", and "Super C-band" are commercial and industry designations, not formal ITU-T classifications. The ITU-T formally defines the C-band as 1530–1565 nm; spectrum extensions beyond this boundary are implementation choices by equipment vendors and network operators, not amendments to the standard.
When even the Super C-band's 120 wavelengths at 100 Gbps — 12 Tbps per fibre pair — proves insufficient for traffic demand, the next logical step is L-band activation, which the following section addresses.
C Band Applications: Long-Haul, Metro, and Submarine
The physics covered in the preceding sections — ~0.2 dB/km attenuation, EDFA amplification across the 1530–1565 nm gain window, and the ITU-T DWDM channel grid — do not exist in isolation. They translate directly into the engineering architecture of three distinct network types, each of which depends on the C-band for different reasons and under different constraints.
Long-Haul Terrestrial Networks
Long-haul terrestrial systems are where the C-band's attenuation advantage is most directly exploited: the ~0.2 dB/km loss of standard single-mode fibre (ITU-T G.652) allows EDFA-amplified spans with a nominal amplifier spacing of around 80 km, as specified in ITU-T G.692.
Intercity and international terrestrial links spanning thousands of kilometres are built as cascaded EDFA chains — a sequence of amplified spans that collectively maintain signal quality without optical-electrical-optical conversion at any intermediate point.
The C-band's ~4.4 THz of optical bandwidth supports DWDM channel plans at 50 GHz or 100 GHz spacing, carrying 80 or more simultaneous wavelengths per fibre pair, per ITU-T G.694.1 and IEEE sources — making the per-fibre aggregate capacity of these links extraordinary by any earlier transmission standard.
Two ITU-T standards define the relevant interfaces for long-haul terrestrial systems: G.959.1 covers optical transport network physical layer inter-domain interfaces for WDM systems, addressing intra-office, short-haul, and long-haul applications; G.696.1 covers longitudinally compatible intra-domain DWDM applications, with or without line amplifiers, for distances that can exceed 1,000 km.
Metropolitan Networks
Metro networks operate over shorter distances and with different amplification economics than long-haul: spans are typically in the range of 30–80 km, and many metro links are unamplified or lightly amplified, relying on the C-band's low attenuation to deliver adequate margin without a full cascaded amplifier chain.
ITU-T G.698.1 defines DWDM systems for metro applications — specifically, point-to-point and ring configurations with transmission distances of approximately 30–80 km and channel bit rates up to 25 Gbit/s (2023 edition), with 50 GHz and 100 GHz channel frequency spacing.
The C-band's DWDM compatibility makes it the default choice for the metro rings and point-to-point links that connect data centres, internet exchanges, and aggregation nodes within a metropolitan area — a practical consequence of the same physics that enables long-haul, applied at shorter scale.
The contrast with long-haul is worth stating plainly: metro systems prioritise flexibility and low amplification overhead, while long-haul systems prioritise maximum reach and channel count — the C-band serves both architectures, but the engineering trade-offs are distinct in each.
Submarine Cable Systems
Submarine cable systems represent the most demanding deployment context for c band optical transmission — transoceanic spans of 6,000–8,000 km are achieved without any optical-electrical-optical regeneration, relying entirely on the combination of low fibre attenuation and all-optical EDFA amplification.
ITU-T G.977 covers the system performance and interface requirements of repeatered optically amplified submarine cable systems, addressing single-wavelength, WDM, and DWDM configurations — the standard that governs how these extraordinary links are specified and built.
Submarine systems push C-band engineering to its limits through two interconnected constraints: fibre and amplifier spacing.
On the fibre side, pure-silica-core fibres compliant with ITU-T G.654 are used in submarine cables, achieving attenuation values of 0.15–0.19 dB/km at 1550 nm — measurably lower than the ~0.174–0.20 dB/km of standard G.652 fibre, and critical for maximising reach between repeaters.
On the amplifier side, the ITU-T Optical Fibre Handbook notes that for transoceanic links of 6,000–8,000 km, the maximum repeater spacing is around 50 km — tighter than the ~80 km typical of terrestrial links — because the power budget for submerged repeaters is supplied from shore via the cable itself, which constrains how frequently amplifiers can be placed.
Transoceanic submarine cables carry traffic across thousands of kilometres of open ocean without a single optical-electrical-optical conversion. That achievement rests entirely on the C-band's ~0.15 dB/km pure-silica-core fibre loss and EDFA amplification — the same physics described earlier in this guide, operating at its absolute engineering limit.
Beyond telecommunications infrastructure, the 1530–1565 nm window carries a secondary benefit relevant to free-space optical (FSO) communications and sensing: the maximum permissible exposure (MPE) at these wavelengths is higher than at shorter near-infrared alternatives such as 1064 nm, which reduces hazard zone requirements in outdoor or open-path deployments where operator safety matters.
Each of the deployment contexts described here — long-haul, metro, and submarine — shares one transmission impairment that grows with distance and bit rate: chromatic dispersion, the wavelength-dependent variation in propagation speed that causes signal pulses to broaden over distance, and which the next section addresses in full.
Tailored EDFAs for C-Band Network Deployments
Whether you are designing long-haul, metro, or free-space links, the right EDFA is central to performance. We build custom EDFAs tailored to your application — speak with our team to discuss your requirements.

Managing Chromatic Dispersion in C Band Systems
Low attenuation and EDFA amplification give C-band systems the reach to span thousands of kilometres — but they do not solve a second, equally serious impairment that grows with every kilometre of fibre: chromatic dispersion. At 10 Gbit/s and above, unmanaged dispersion is not a performance nuisance; it is a hard limit on how far a signal can travel before it becomes unrecoverable.
Chromatic dispersion arises because different wavelength components within a modulated optical pulse travel at slightly different group velocities through the fibre — a phenomenon formally described as group velocity dispersion (GVD).
The practical consequence is temporal pulse broadening: as the pulse propagates, its leading and trailing edges spread apart in time until the pulse overlaps with its neighbours, producing inter-symbol interference (ISI) that degrades bit error rate and ultimately caps both bit rate and reach.
For standard single-mode fibre (ITU-T G.652), the dispersion coefficient at 1550 nm is a non-trivial positive value — significant enough that over a 1,000 km long-haul link the accumulated dispersion becomes a severe impairment at 10 Gbit/s and essentially fatal at 40 Gbit/s and above without active compensation.
Chromatic dispersion in single-mode fibre has two physical contributors: material dispersion, which arises from the wavelength dependence of silica glass's refractive index, and waveguide dispersion, which arises from the wavelength dependence of how light is confined within the core-cladding structure.
In G.652 fibre, these two contributions combine to place the zero-dispersion wavelength (ZDW) near 1310 nm — in the O-band — not in the C-band at 1550 nm. This is why dispersion carries a positive, non-trivial value throughout the C-band for G.652 fibre: it cannot simply be engineered away for this fibre type.
Fibre Design Responses: DSF and NZDSF
Fibre manufacturers responded by developing dispersion-shifted fibre (DSF), standardised as ITU-T G.653, which modifies the waveguide dispersion contribution to shift the ZDW from 1310 nm toward 1550 nm, aligning it with the C-band's minimum-loss window.
The approach backfired in DWDM systems: G.653 fibres with zero (or near-zero) dispersion at 1550 nm suffer from severe four-wave mixing (FWM), because channels propagating at nearly identical group velocities interact efficiently through phase-matched nonlinear mixing, generating spurious tones that degrade channel integrity across the entire DWDM comb.
The industry's answer was non-zero dispersion-shifted fibre (NZDSF), standardised as ITU-T G.655 and G.656: these fibres maintain a small but deliberately non-zero dispersion across the C-band, sufficient to disrupt FWM phase-matching while still reducing the accumulated dispersion burden relative to G.652. NZDSF became the preferred fibre choice for new DWDM long-haul installations through the late 1990s and 2000s.
The engineering tension at the heart of C-band fibre design is clear: shifting the ZDW to 1550 nm eliminates the dispersion burden but opens the door to catastrophic FWM, while NZDSF threads the needle by accepting a modest residual dispersion in exchange for DWDM compatibility. G.653, despite its dispersion advantage, proved unsuitable for multi-channel long-haul and has seen little deployment in DWDM networks.
Compensation Approaches Across Three Generations
Even with NZDSF, long-haul C-band systems accumulate dispersion that must be actively compensated. Three successive approaches have defined the industry's response, each tied to a specific generation of line rate.
At 10 Gbit/s, the workhorse method was dispersion compensating fibre (DCF): a specially designed fibre with a large negative dispersion coefficient, coiled into modules and inserted within EDFA amplifier interstages to provide negative dispersion that cancels the accumulated positive dispersion of the transmission span.
DCF carries real engineering costs: its attenuation per kilometre is substantially higher than standard SMF, and its smaller effective area increases susceptibility to nonlinear optical effects — so each DCF module adds both insertion loss and nonlinear penalty to the optical path.
These trade-offs were manageable at 10 Gbit/s but grew increasingly problematic as line rates rose, driving the industry toward alternative compensation methods for 40 Gbit/s deployments.
At 40 Gbit/s, the tighter dispersion tolerance made residual errors left uncorrected by bulk DCF a critical problem, driving adoption of fibre Bragg gratings (FBGs) as tunable per-channel compensators alongside DCF.
A chirped fibre Bragg grating is a periodic refractive index modulation written into a short length of fibre whose period varies along its length; different wavelengths are reflected at different positions within the grating, introducing a controlled differential delay that compensates the dispersion accumulated in the transmission fibre.
FBGs are physically compact — centimetres to metres, compared with kilometres of DCF — and offer low insertion loss, making them well-suited to per-channel dispersion trimming. Their limitation is bandwidth: a single FBG compensates a relatively narrow wavelength range, making broadband DWDM compensation across many simultaneous channels impractical without a large array of devices.
The architectural shift came with 100 Gbit/s coherent transmission, where coherent DSP in the receiver compensates chromatic dispersion entirely in the electrical domain, rendering in-line optical compensation largely redundant for new deployments.
Coherent detection recovers the full optical field — amplitude and phase — which allows the DSP to apply a digital inverse filter that reverses the dispersive distortion accumulated over the entire link, compensating dispersion equivalent to thousands of kilometres of fibre without any optical hardware in the line system.
At 10 Gbit/s, optical DCF modules were standard equipment in every amplifier span. At 100 Gbit/s with coherent detection, DSP-based electronic compensation has effectively eliminated the need for in-line dispersion compensation hardware — removing a significant source of loss and nonlinearity from the optical path in the process.
This is not an incremental improvement over DCF and FBGs — it is a qualitative change in system architecture. By moving dispersion compensation from the optical domain into software running on application-specific silicon, operators gain dynamic adjustment capability and eliminate physical modules that previously degraded optical signal quality at every span.
Chromatic dispersion is one of several transmission parameters that differ meaningfully across the optical bands — and its behaviour in the C-band, while well-characterised and now largely managed through coherent DSP, does not tell the whole story once operators consider expanding capacity into adjacent bands. The next section examines how the C-band and L-band compare across dispersion, nonlinearity, and system architecture.
What is the Difference Between C Band and L Band?
The C-band versus L-band question is often framed as a choice between two competing options — but that framing misses the point entirely. In practice, the L-band is not an alternative to the C-band; it is the next layer that operators activate on top of it when C-band capacity runs out. Understanding the difference between these two bands is really a question about capacity ceilings and how the industry extends beyond them.
As defined in ITU-T G.Sup39, the L-band — the "Long wavelength" band — spans 1565–1625 nm, sitting immediately above the C-band's upper boundary of 1565 nm in the ITU-T optical band hierarchy. The two bands are physically contiguous, separated only by a narrow spectral gap in practical system implementations.
The physical case for L-band as the natural expansion target is grounded in its attenuation profile. Across the combined C+L window, the fibre attenuation coefficient variation is approximately 0.01 dB/km — negligible for system design purposes. This contrasts sharply with the O-, E-, and S-bands, which carry meaningfully higher attenuation or require amplifier technologies far less commercially mature than the EDFA ecosystem operators already rely on.
Amplification is the other decisive factor. As covered in the EDFA section of this guide, erbium-doped fibre amplifiers can be extended to the L-band by adjusting the erbium inversion level — a lower inversion state shifts the gain window from C-band into L-band wavelengths. In a C+L system, each band requires a dedicated EDFA stage, but both stages draw on the same proven erbium-doped fibre technology, with no need for an entirely different amplifier paradigm.
| Parameter | C-band | L-band |
|---|---|---|
| ITU-T designation | Conventional band | Long wavelength band |
| Wavelength range | 1530–1565 nm | 1565–1625 nm |
| Typical fibre attenuation (G.652) | ~0.19–0.20 dB/km | ~0.20–0.21 dB/km |
| Attenuation difference vs C-band | Baseline | ~0.01 dB/km higher across C+L window |
| Amplifier technology | C-band EDFA (standard) | L-band EDFA (adjusted inversion level) |
| EDFA noise figure | ~5.5 dB | ~6 dB |
| Bandwidth contribution | ~5 THz | ~5 THz |
| Typical activation trigger | Primary band — activated first | Activated when C-band capacity is exhausted |
Side-by-side comparison of C-band and L-band across the key parameters an operator evaluates when considering capacity expansion: wavelength range, attenuation, amplifier technology, bandwidth contribution, and typical activation trigger.
The table makes the operator's decision logic clear: the attenuation and amplifier technology gaps between C-band and L-band are real but narrow. The 0.01 dB/km attenuation difference is operationally negligible over typical span lengths, and the noise figure penalty of approximately 0.5 dB for L-band EDFAs adds system design complexity without negating the capacity value. The activation trigger column captures the essential point — L-band is not an alternative starting point; it is a second stage that follows C-band exhaustion.
Operating over C+L band provides approximately 10 THz of total optical bandwidth — roughly 5 THz from each band. Research modelling of backbone networks reports capacity gains of approximately 100% compared to C-band-only operation, with one study of a large Indian backbone network reporting gains of 103–108% at optimum channel launch powers.
The decision to activate L-band is driven by economics and infrastructure constraints, not technology preference. When C-band spectral resources are exhausted and laying additional fibre is either too costly or physically impractical on a given route, L-band activation reuses the existing fibre plant entirely — no new cable, no new amplifier paradigm, no fundamental change to the system architecture.
Engineering Considerations in C+L Systems
Adding L-band to an operating C-band system is not without engineering complexity. The most significant nonlinear effect to manage is inter-channel stimulated Raman scattering (ISRS) — a process in which optical power is transferred from higher-frequency (shorter-wavelength) C-band channels to lower-frequency (longer-wavelength) L-band channels as signals propagate through the fibre.
This inter-band power transfer is not a minor footnote in C+L system design — it must be explicitly modelled and actively managed. The magnitude of the ISRS effect scales with total launch power and spectral occupancy across the 10 THz window, creating a wavelength-dependent OSNR profile that differs substantially from what a C-band-only system would exhibit.
Beyond ISRS, L-band channels also exhibit slightly higher chromatic dispersion than C-band channels at equivalent fibre lengths, and L-band EDFAs carry a marginally higher noise figure — approximately 6 dB versus 5.5 dB for C-band EDFAs. These are manageable trade-offs in a well-engineered system, not showstoppers, but they do require explicit treatment in link budget and reach calculations.
The critical framing to carry forward is this: C+L systems are C-band systems with L-band added, not systems in which the two bands are treated as equivalent alternatives. The C-band remains the primary operating band — the foundation on which L-band capacity is built. Operators do not choose between C-band and L-band; they operate C-band first and extend into L-band when the capacity ceiling demands it.
Expansion beyond C+L — into the S-band, O-band, and wider ultra-wideband spectrum — requires fundamentally different amplifier technologies: thulium-doped fibre amplifiers (TDFAs) for the S-band, Raman amplification, and bismuth-doped fibre amplifiers for the O-band. As the Poggiolini et al. review in the Proceedings of the IEEE notes, these alternatives have yet to reach sufficient commercial maturity for widespread deployment, which is precisely why C+L remains the industry's practical near-term expansion path.
With the C-band's physics, amplification architecture, channel standards, deployment contexts, dispersion behaviour, and capacity ceiling now fully mapped, the conclusion draws the full picture together — from the fundamental attenuation minimum at 1550 nm through to the engineering decisions that define how operators maximise the spectral resource it provides.
Conclusion
Physics, Standards, and the Foundation of Optical Networking
The C-band did not become the foundation of global optical networking because standards bodies chose it or vendors backed it — it became the foundation because physics left no better option: the point where silica fibre loses the least light is, with remarkable precision, the same point where erbium ions amplify it.
For engineers evaluating amplification in a specific deployment context, that alignment is the starting point worth holding onto — because how well a system's EDFA characteristics map to the application's reach, power, and integration constraints will shape everything downstream.
Frequently Asked Questions About C Band Optical
Precise answers to the questions most commonly asked about the C-band in optical fibre communications.
Yes — emphatically so. The C-band remains the dominant transmission band in long-haul and DWDM networks worldwide. Extended and Super C-band variants have pushed channel counts from the original 80-wavelength standard to 96 and then 120 wavelengths per fibre pair. Coherent technology has driven per-channel capacity to 400 Gbit/s and beyond, with 800 Gbit/s systems already in commercial deployment. C+L configurations add L-band capacity on top of the C-band rather than replacing it — the L-band is additive, not a substitute. The C-band's relevance is not diminishing; it is the foundation on which every subsequent layer of bandwidth expansion is built.
The most widely deployed fibre for C-band transmission is standard single-mode fibre (ITU-T G.652), which has a zero-dispersion wavelength around 1310 nm and a typical attenuation of approximately 0.275 dB/km in the 1530–1565 nm window. Non-zero dispersion-shifted fibre (G.655 / NZDSF) was developed specifically for C-band DWDM: it maintains a small but non-zero chromatic dispersion coefficient (between 0.1 and 10.0 ps/nm·km, with Dmin no lower than 1.0 ps/nm·km) across the C-band to suppress four-wave mixing without the severe accumulated dispersion of G.652. G.654 (cutoff-shifted, loss-optimised fibre) is used in submarine and ultra-long-haul terrestrial applications where minimum attenuation in the 1530–1625 nm region is critical — pure-silica-core variants achieve 0.15 to 0.19 dB/km at 1550 nm, the lowest available in commercial single-mode fibre.
The ITU-T-defined C-band spans 1530–1565 nm, corresponding to approximately 4.4 THz of optical bandwidth — a figure derived from the wavelength-to-frequency conversion across the 35 nm window. Commercial systems routinely operate across a wider range: the extended C-band reaches approximately 4.8 THz, and the Super C-band (C120) covers around 6 THz. When the L-band is added alongside the C-band in a C+L configuration, the combined usable spectrum approaches 10 THz or more, depending on whether extended or super variants of each band are deployed.
193.1 THz (approximately 1552.52 nm) was chosen as the reference anchor for the ITU-T G.694.1 DWDM frequency grid because it falls near the centre of the C-band, within the erbium gain window, and provides a convenient round-number reference point. All allowed channel frequencies are defined as integer multiples of the channel spacing — 12.5, 25, 50, or 100 GHz, or wider — offset from this anchor, using the formula 193.1 + n × channel spacing (in THz). The practical purpose of this anchoring is multivendor interoperability: any compliant transmitter, multiplexer, or receiver from any manufacturer will align on the same channel grid. The choice of 193.1 THz specifically is a standards convention rather than a physical necessity; what matters is that it sits within the C-band and provides a single, consistent reference shared across all four fixed-grid spacings defined in G.694.1.
EDFAs are typically pumped at either 980 nm or 1480 nm (also cited as 1450 nm in some references). Both wavelengths efficiently excite erbium ions (Er³⁺) into the ⁴I₁₃/₂ metastable state, from which stimulated emission at 1530–1565 nm produces optical gain. The trade-off between the two pump wavelengths is well established: the 980 nm pump drives erbium ions first to the short-lived ⁴I₁₁/₂ level, from which they rapidly relax to the metastable gain level, yielding a higher population inversion and a lower noise figure — making it the preferred choice for pre-amplifier stages where noise performance is most critical. The 1480 nm pump drives transitions directly into the upper manifold of the gain level, providing higher output power and better efficiency at high inversion levels, which suits booster and in-line amplifier stages. In practice, many high-performance EDFA designs combine both pump wavelengths to optimise gain, noise figure, and output power simultaneously across cascaded amplifier chains.
Yes. The 1530–1565 nm window supports a range of applications outside conventional fibre telecommunications, unified by three practical advantages: low-loss propagation in silica fibre, access to mature EDFA amplification infrastructure, and a wavelength profile that is significantly eye-safer than shorter alternatives such as 1064 nm — the human eye absorbs strongly above 1400 nm in the cornea and lens, preventing the beam from reaching the retina and permitting much higher permitted emission powers. Key application domains include LiDAR (particularly airborne and UAV-mounted systems where eye safety and compactness are both required), free-space optical (FSO) communications (where C-band hardware is directly compatible with existing fibre infrastructure and EDFA amplification extends link budgets), distributed acoustic sensing (DAS) (which can occupy unused ITU-T grid wavelengths on installed fibre spans), quantum key distribution (QKD) and quantum sensing (where the C-band's low loss and compatibility with standard DWDM components enables integration with classical network infrastructure), and defence applications where the 1550 nm region's low probability of intercept by night-vision devices and its tolerance for higher emission powers are operationally significant.