

Introduction
If you are designing or specifying optically amplified links, ASE noise is not a footnote — it is the central constraint around which every other system decision is made.
Most accessible material on the subject either stays at the surface or lives behind paywalls, leaving engineers to piece together the physics from fragments that rarely connect cause to consequence.
What follows goes deeper: from the quantum origins of spontaneous emission, through ASE's spectral character and coherence properties, through its effects on gain, noise figure, and signal quality across amplifier chains, to the design choices and mitigation strategies that give engineers real control.
The aim is clarity that lets you reason through trade-offs confidently, not just apply rules of thumb.
TL;DR
ASE noise is an unavoidable consequence of optical amplification — rooted in quantum mechanics, not imperfect engineering. Understanding it at the physics level, rather than treating it as a black-box penalty, is what separates engineers who reason through system trade-offs from those limited to following pre-set rules of thumb.
This article covers:

Quantum mechanical origins of ASE in erbium-doped fibre
ASE spectral profile and coherence properties
Gain compression and amplifier noise figure
OSNR degradation and BER impact in cascaded systems
EDFA design parameters that govern ASE behaviour
Practical ASE mitigation: filtering, gain flattening, amplifier configuration
What is EDFA ASE?
Every photon of gain an erbium-doped fibre amplifier produces comes with an unavoidable companion: optical noise generated by the same quantum process that makes amplification possible in the first place.
Amplified spontaneous emission (ASE) is that noise. It arises directly from the population inversion that enables signal gain — and because population inversion is the prerequisite for any stimulated-emission-based amplifier, ASE is not a side-effect that better engineering could eliminate. It is a physical law.
The Er³⁺ Energy Structure and Population Inversion
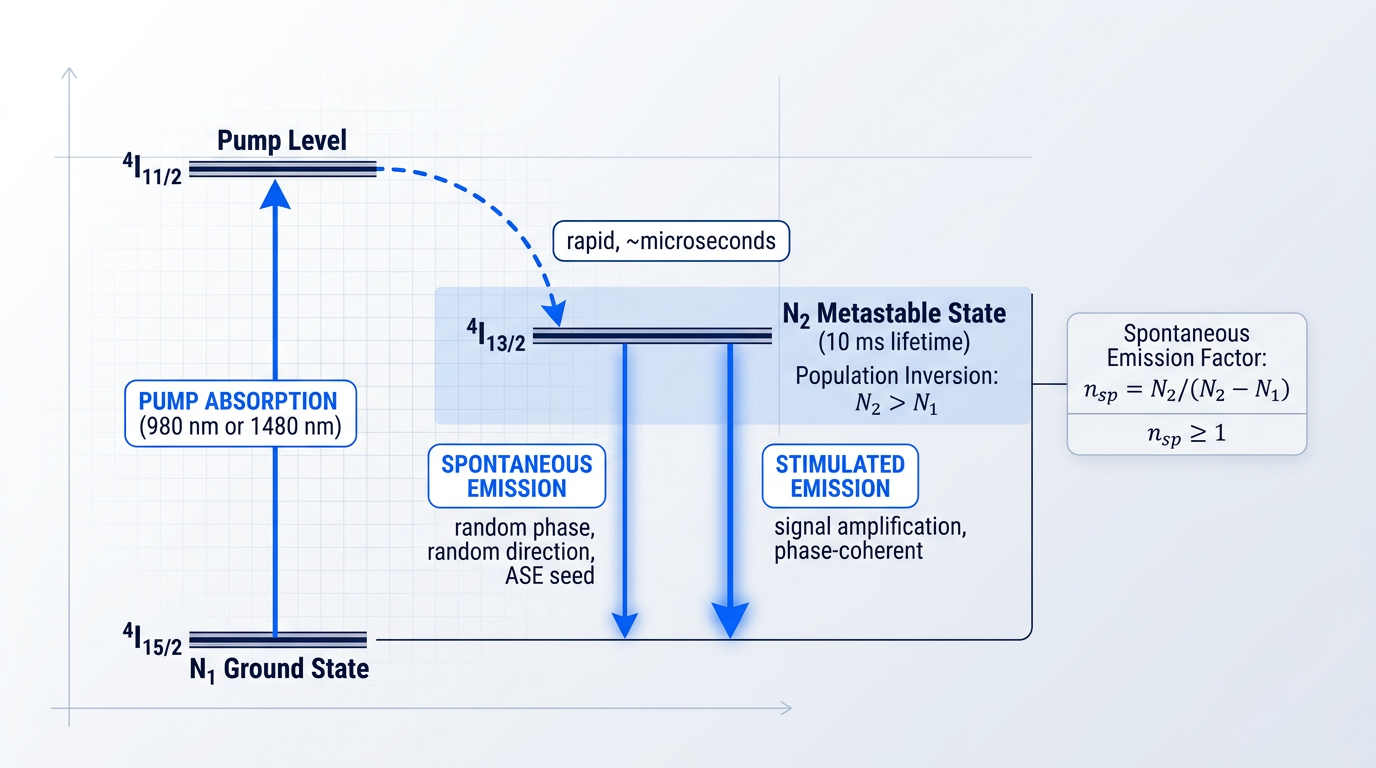
The physics begins with the erbium ion (Er³⁺) embedded in silica glass. Er³⁺ has three energy levels relevant to amplification: the ground state (⁴I₁₅/₂), the metastable state (⁴I₁₃/₂), and the pump level (⁴I₁₁/₂). Pump light at 980 nm drives ions from the ground state up to ⁴I₁₁/₂, from which they decay rapidly and non-radiatively into ⁴I₁₃/₂; pump light at 1480 nm drives ions directly into ⁴I₁₃/₂.
The ⁴I₁₃/₂ level is described as metastable because ions that reach it linger there for approximately 10 milliseconds — an extraordinarily long upper-state lifetime by atomic standards. This slow decay is precisely what allows a large population of excited ions to accumulate, making sustained population inversion practical.
Population inversion means that more ions occupy the excited ⁴I₁₃/₂ state (N₂) than the ground state (N₁). This condition is the prerequisite for net signal gain — but it simultaneously guarantees that spontaneous emission events will occur continuously, because any excited ion can decay at any moment regardless of whether a signal photon is present.
Spontaneous vs Stimulated Emission: The ASE Seed
Stimulated emission occurs when an incoming photon triggers an excited Er³⁺ ion to release a second photon that is phase-coherent with the first, at the same wavelength, travelling in the same direction — this is the mechanism of signal amplification. Spontaneous emission, by contrast, occurs when an excited ion decays independently of any incoming photon, releasing a photon with random phase, random polarisation, and a random direction distributed across the full gain bandwidth.
That spontaneously emitted photon is the seed of ASE. On its own it is a single noise photon of negligible power — but its fate inside the erbium-doped fibre determines everything that follows.
The degree to which spontaneous emission dominates over stimulated emission is captured by the spontaneous emission factor, written as nsp and defined as N₂/(N₂ − N₁). When inversion is complete (N₁ ≈ 0), nsp approaches its minimum value of 1. When inversion is only partial (N₁ > 0), nsp exceeds 1, meaning a greater proportion of decay events are spontaneous relative to stimulated — and ASE power rises accordingly.
nsp = N2 / (N2 − N1) is the single parameter that connects the degree of population inversion to ASE power and noise figure. It appears in every quantitative treatment of EDFA noise performance: a perfectly inverted amplifier reaches the quantum-limited minimum of nsp = 1, while any partial inversion drives nsp above 1 and degrades noise performance proportionally.
From Spontaneous Photon to Amplified Noise
A spontaneous photon emitted along the axis of the erbium-doped fibre does not simply escape — the fibre waveguide captures it and guides it through the gain medium, where it triggers stimulated emission from other excited ions exactly as a signal photon would. This is the "amplified" in amplified spontaneous emission: a noise photon acting as its own signal seed.
ASE power consequently grows with both fibre length and amplifier gain. A longer gain medium gives each seed photon more distance over which to accumulate stimulated copies; higher gain means each copy triggers yet more emission, so ASE power scales with the gain G in a relationship that grows exponentially with fibre length up to the point of optimal inversion.
Spontaneous photons are emitted in both directions along the fibre axis. Those emitted co-propagating with the signal are amplified toward the output, producing forward ASE; those emitted in the opposite direction are amplified back toward the pump input, producing backward ASE. Both are present simultaneously and both are direct consequences of the same population inversion that generates gain.
ASE is not a failure of design — it is an inescapable consequence of operating any population-inverted gain medium, whether an EDFA, a semiconductor optical amplifier, or a Raman amplifier. The engineering challenge is not elimination but management: understanding ASE well enough to control its impact on system performance. With that foundation in place, the next question is what ASE actually looks like as a noise field — its spectral profile, its coherence properties, and why those physical characteristics matter for how it is filtered and how it propagates through a system.
ASE Spectral Characteristics and Coherence Properties
Knowing that ASE exists is not enough to engineer around it. What matters is its shape: where in the spectrum it concentrates, how that distribution shifts with operating conditions, and why its coherence properties are fundamentally different from those of the signal light it accompanies. These physical characteristics are not academic details — they determine which mitigation techniques are viable and which receiver noise mechanisms dominate.
The ASE spectral profile is not a flat noise floor. It is a spectrally shaped noise field whose envelope directly tracks the gain spectrum of the erbium-doped fibre — ASE power density is highest where gain is highest, and falls away where gain falls away.
The erbium gain bandwidth in silica fibre extends from approximately 1525–1565 nm, shaped primarily by the Stark splitting of the erbium ion's ground and excited states in the local glass electric field, as described in the ScienceDirect gain-spectrum reference.
Within this bandwidth, the gain — and therefore the ASE — is not uniformly distributed. The UCSB ECE228B lecture notes describe a pronounced gain peak around 1530 nm and a semi-flat gain region spanning roughly 20–30 nm at longer wavelengths, confirmed by the ScienceDirect erbium-doped fibre topic, which places the flatter region between 1540 and 1560 nm.
This non-uniformity has direct engineering consequences: WDM channels near 1530 nm accumulate disproportionately more ASE noise than channels in the flatter 1540–1560 nm region, and this spectral imbalance is the physical motivation for gain-flattening filter design, addressed in the mitigation section later.
The ASE spectrum is not fixed — it shifts with the amplifier's population inversion level. The gain spectrum shape is determined by the distribution of Stark-split sub-levels and the thermal distribution of their populations, which changes as the overall inversion changes.
Published measurements confirm this dependence with specific figures: at approximately 80% inversion, the ASE spectrum peaks near 1530 nm, while at approximately 40% inversion the emission peak shifts toward the 1545–1560 nm range.
The practical implication is that the amplifier's operating point — set by pump power relative to signal load — affects not just the magnitude of gain but the spectral shape of the ASE it generates, which matters for gain-flattening design and for interpreting measured ASE spectra under different load conditions.
| Population Inversion Level | ASE Spectral Peak Region |
|---|---|
| ~80% | Near 1530 nm |
| ~40% | 1545–1560 nm range |
Shows how ASE spectral peak wavelength shifts with population inversion level, grounded in published measurement data from the ScienceDirect journal article (pii/S0030401801012706).
This inversion-dependence means that two nominally identical amplifiers running at different pump powers will produce ASE spectra with different shapes — a subtlety that matters when designing gain-flattening filters or diagnosing unexpected channel power imbalances in a WDM system.
Coherence Properties: How ASE Differs from Signal Light
The most consequential difference between ASE and laser signal light is not spectral width but coherence — and specifically, the near-total absence of temporal coherence in ASE.
A laser signal has a well-defined phase relationship between photons over long time intervals: its narrow linewidth corresponds to a long coherence time, which is inversely proportional to its spectral bandwidth (τ_c ≈ 1/Δν, as described in the coherence time literature).
ASE photons, by contrast, arise from independent spontaneous decay events with entirely random phase relationships — there is no synchronisation between emitting ions, so the aggregate field has a phase that wanders randomly on a timescale set by its broad optical bandwidth.
Because ASE spans tens of nanometres of optical bandwidth, its coherence time is extremely short: the broader the spectrum, the faster the phase decorrelates, and the more completely ASE behaves as an incoherent noise field rather than a coherent wave.
Spatially, ASE originates from spontaneous emission events distributed throughout the fibre volume, making it in principle spatially multimode in origin. In practice, the single-mode fibre waveguide selects predominantly the fundamental guided mode, so the ASE that propagates efficiently is largely confined to that mode — which is why ASE power calculations and optical filtering treat ASE as a guided-mode noise field.
ASE Directionality: Forward and Backward Propagation
Spontaneous photons are emitted in all directions, but the fibre geometry strongly selects for those emitted along the fibre axis: only axially propagating photons travel through the full length of the gain medium and experience the maximum accumulated gain.
This selection mechanism is why ASE propagates predominantly as a guided field along the fibre axis rather than as isotropic radiation — the gain medium's geometry amplifies axial photons far more than those emitted at other angles.
- Forward ASE: Co-propagates with the signal toward the amplifier output, reaching the receiver and directly degrading optical signal-to-noise ratio.
- Backward ASE: Counter-propagates toward the pump input, depleting population inversion along the fibre and reducing available gain for the signal.
Both directions are a concern, but for different reasons: forward ASE is the primary contributor to receiver noise, while backward ASE acts as an internal parasitic load on the amplifier's excited-state population — a distinction that informs where isolators and filters are placed within an amplifier stage.
ASE's broad optical bandwidth and temporal incoherence make it spectrally separable from the signal. A narrow optical band-pass filter can reject ASE power outside the signal band without touching the signal itself. Phase noise, being co-spectral with the signal, cannot be removed this way. This distinction is the physical foundation for optical filtering as an ASE mitigation technique.
ASE's temporal incoherence also determines the specific beat-noise mechanisms that degrade receiver performance: signal-ASE beat noise arises from the cross-term between the coherent signal field and the incoherent ASE field at the square-law photodetector, while ASE-ASE beat noise arises from the self-mixing of ASE within the receiver's electrical bandwidth.
These two mechanisms — named here because they appear in every rigorous treatment of EDFA noise — will be developed fully in the OSNR and BER sections that follow.
The spectral and coherence properties described here are not merely descriptive: they govern how ASE interacts with the amplifier's own population inversion, drawing down the excited-state ions that would otherwise amplify the signal — which is the subject of the next section.
How ASE Causes Gain Compression in EDFAs
An EDFA can be partially saturated by its own noise — not by the signal it is trying to amplify, but by the very ASE it generates in the process. This is one of the more counterintuitive failure modes in optical amplifier design, and understanding it is essential to avoiding it.
The mechanism is a direct consequence of quantum physics. ASE photons that fall within the erbium gain bandwidth interact with excited Er³⁺ ions through stimulated emission — the same process by which signal photons are amplified.
This means ASE and the signal are in direct competition for the same finite resource: the population inversion stored in excited erbium ions. Every stimulated emission event triggered by an ASE photon consumes an excited ion that would otherwise have contributed gain to the signal.
The dynamic is self-reinforcing. ASE power grows with gain and fibre length; as ASE power increases, it depletes more of the inversion; depleted inversion reduces the gain available to the signal, while continuing to generate further ASE — a cycle that tightens with every additional centimetre of doped fibre.
The net result is gain compression: the effective gain seen by the signal falls below the small-signal gain as ASE power accumulates. At low ASE levels the signal sees the full available inversion; as ASE power grows, the amplifier is progressively saturated by its own noise field and the signal receives a diminishing share of that inversion.
Optimal Fibre Length and Gain Roll-Off
A common design misconception is that gain scales monotonically with fibre length. It does not. For a given pump power, gain rises with length up to an optimal fibre length, then rolls off — often sharply.
Beyond the optimal length, the pump has been substantially absorbed by the earlier sections of the fibre. The distal sections become under-inverted: the population inversion there is insufficient to produce net gain, so those sections absorb signal photons rather than amplifying them.
Under-inverted sections also generate ASE from residual excited ions, and that ASE propagates back through the fibre, further depleting inversion in the upstream sections. The amplifier is effectively working against itself.
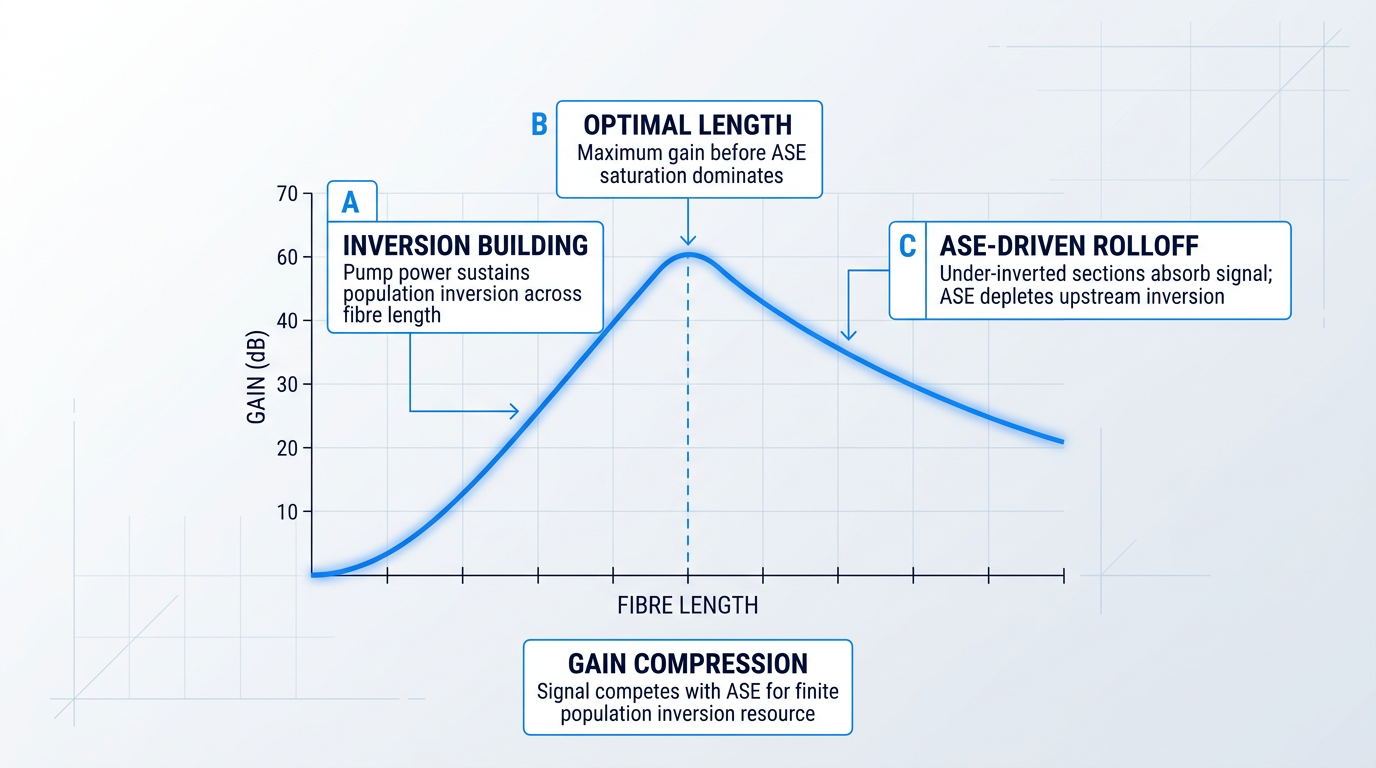
The practical implication is that fibre length L and pump power must be co-optimised rather than treated as independent variables. Increasing L without a corresponding increase in pump power pushes the amplifier past its optimal operating point, producing ASE-driven gain compression rather than additional signal gain.
Conversely, raising pump power extends the optimal length and raises the gain ceiling before ASE saturation sets in. The principle is straightforward: more fibre is only beneficial when the pump can sustain adequate inversion across that additional length.
Gain compression is also not uniform across the C-band. Because ASE power is disproportionately concentrated near the 1530 nm gain peak — where gain is highest at elevated inversion levels — that spectral region experiences the greatest ASE-driven depletion of population inversion.
The consequence is wavelength-dependent compression: channels near 1530 nm are saturated more heavily than those at longer C-band wavelengths, introducing gain non-uniformity across the amplifier's operating bandwidth. This has direct implications for multi-channel system design, though the techniques used to address it are covered later in this guide.
Signal-Driven vs ASE-Driven Saturation
The term gain saturation appears frequently in EDFA literature, but it describes two categorically different phenomena that must not be conflated.
- Signal-driven saturation: The signal itself depletes population inversion. This is the intended operating regime for booster amplifiers, where maximising output power is the design goal.
- ASE-driven saturation: ASE power depletes population inversion before the signal can benefit from it. The amplifier is saturated by noise — no useful output power is gained.
Signal-driven saturation is a controlled, engineered operating point. ASE-driven saturation is not: the amplifier expends its population inversion on amplifying noise, and the signal receives compressed gain with no compensating benefit in output power.
When an amplifier saturates on its signal, it is doing its job at high power. When it saturates on ASE, it is consuming its gain resource on noise — the signal is penalised with no useful work done.
This distinction matters because engineers accustomed to thinking about signal-driven saturation as a normal operating regime can underestimate how damaging ASE-driven saturation is. There is no useful output power gained when ASE drives the amplifier into compression — only degraded signal gain and worsened noise performance.
Understanding that ASE compresses gain is the necessary foundation for the next question: by how much, and how do we quantify it? That is precisely what noise figure answers — providing a rigorous, measurable metric for the SNR penalty ASE-driven saturation imposes on the system.
Noise Figure: How ASE Determines EDFA Noise Performance
All the ASE physics covered so far — the spontaneous emission that seeds the noise field, the population inversion that amplifies it, the gain compression it causes — ultimately registers in a single engineering number: the noise figure (NF). It is the metric that translates quantum-level physics into a quantity that goes directly into link budgets, amplifier specifications, and system design decisions.
Noise figure is defined as the ratio of the signal-to-noise ratio at the amplifier input to the SNR at the output: NF = SNR_in / SNR_out, or equivalently in decibels, NF(dB) = SNR_in(dB) − SNR_out(dB). A noiseless amplifier would leave the SNR unchanged and yield NF = 1 (0 dB); any real amplifier degrades the SNR, so NF is always greater than unity.
The physical link between NF and ASE is captured by the ASE noise power equation: P_ASE ≈ 2 · n_sp · hν · (G − 1) · ΔB. Each term has a distinct physical role: n_sp is the spontaneous emission factor, encoding the degree of population inversion; hν is the energy of a single photon at the signal wavelength; G is the amplifier gain; and ΔB is the optical measurement bandwidth.
The (G − 1) term deserves particular attention: ASE power grows with gain but is not simply proportional to it, because it counts the number of spontaneous photons amplified along the fibre length rather than just scaling by the terminal gain value.
The factor of 2 accounts for both orthogonal polarisation modes of the ASE field — spontaneous emission is unpolarised, so it populates both modes equally, doubling the noise power relative to a single-polarisation count.
From this equation, the noise figure can be derived directly. For large gain (G >> 1), the expression simplifies cleanly to F ≈ 2 · n_sp. This is the central result: noise figure is not an independent property of the amplifier — it is a direct readout of how well the erbium ions are inverted. Better inversion means lower n_sp, which means lower NF.
Even with perfect population inversion — every erbium ion in the excited state, n_sp = 1 — the noise figure equation yields F = 2, corresponding to 3 dB. This is the quantum limit for any phase-insensitive optical amplifier. It arises because the amplification process itself necessarily adds at least one noise photon per mode per unit gain, a consequence of quantum mechanics that no engineering refinement can circumvent. No EDFA, regardless of design quality, can achieve NF below 3 dB.
In practice, NF values serve as diagnostic benchmarks that an engineer can use to infer the health of an amplifier. A well-designed EDFA operating at high pump power can approach the quantum limit closely, while an amplifier running at suboptimal pump power or with a fibre length beyond its optimum will exhibit a substantially elevated NF — the gap between measured NF and the 3 dB floor is a direct indicator of how far the population inversion falls short of its theoretical maximum.
At very low pump power, population inversion is poor, n_sp is large, and NF rises sharply — in severely under-pumped conditions, the noise penalty can become large enough to render the amplifier counterproductive as a system element. As pump power increases, NF falls steeply at first, then flattens as inversion approaches its practical maximum.
This diminishing-returns behaviour means there is a practical pump power ceiling beyond which further increases yield negligible NF improvement, with the asymptote set by the quantum limit. The NF-versus-pump-power curve is concave: the steepest gains come earliest, and the final fraction of a decibel costs disproportionately more pump power to recover.
Fibre Length, Pump Depletion, and NF Degradation
There is an optimum fibre length for any given pump power, and exceeding it degrades NF. Beyond the optimal length, pump photons are depleted; the distal section of the fibre is under-inverted, n_sp is large in that region, and those under-inverted sections contribute disproportionate ASE without contributing useful gain.
This is the same pump depletion mechanism responsible for the gain compression discussed in the preceding section — the physics are identical, and the NF penalty is its direct consequence. An engineer observing elevated NF alongside gain compression should treat both as symptoms of the same root cause: insufficient inversion in the latter portion of the active fibre.
Pump Wavelength: The Key Noise Figure Trade-off
The choice of pump wavelength is the most consequential single decision for NF in an EDFA design. At 980 nm, pump photons excite erbium ions to the short-lived ⁴I₁₁/₂ level, which decays non-radiatively to the ⁴I₁₃/₂ metastable level; this two-step process allows the ground-state population to be nearly fully depleted, driving n_sp close to 1 and NF close to the 3 dB quantum limit.
At 1480 nm, pump photons excite ions directly to the ⁴I₁₃/₂ metastable level, but the Boltzmann distribution across the Stark sublevels of that manifold prevents complete inversion — a portion of the population always remains in the lower sublevel, keeping n_sp above 1 and imposing a fundamental NF floor that is meaningfully higher than the quantum limit, regardless of how much pump power is applied.
This NF difference between the two pump schemes is not a matter of engineering refinement — it is rooted in the energy-level physics of the erbium ion itself. For any application where noise figure is the primary constraint, such as a pre-amplifier or the first stage in a long cascade, 980 nm pumping is the correct starting point precisely because it enables a degree of population inversion that 1480 nm pumping cannot physically achieve.
NF captures the noise penalty of a single amplifier in isolation. The more demanding question for system designers is how that penalty compounds when many amplifiers are cascaded across a long-haul link — and that is precisely what the OSNR analysis in the next section addresses.
OSNR Degradation: ASE Noise Across Amplifier Chains
A noise figure of 4 dB is an impressive single-stage result — but it tells you almost nothing about whether your link will close across 80 spans. The moment you chain amplifiers together, the optical signal-to-noise ratio (OSNR) at the receiver becomes the governing constraint, and ASE accumulation across every stage is what erodes it.
For a single amplifier, the working OSNR equation is OSNR ≈ P_in(dBm) − F(dB) + 58 dB, where P_in is the optical signal power entering the amplifier, F is the noise figure established in the preceding section, and the constant 58 dB encodes the photon energy at 1550 nm and the standard 0.1 nm (12.5 GHz) reference bandwidth — specifically, it is 10·log₁₀(1/(hν·B_ref)), with hν ≈ 1.28×10⁻¹⁹ J and B_ref = 12.5 GHz.
The equation's engineering message is unambiguous: for a fixed noise figure, every additional dB of input signal power buys exactly 1 dB of OSNR, and every additional dB of noise figure costs exactly 1 dB of OSNR margin — a direct, one-for-one trade with no mitigation possible downstream.
That irreversibility is the critical physical fact. Once ASE has been added in-band with the signal at any stage, it propagates alongside the signal through every subsequent amplifier, being amplified at each one — there is no optical mechanism that can distinguish in-band ASE from the signal and strip it out.
OSNR Accumulation in Cascaded Amplifier Chains
In a chain of N identical amplifiers, each with gain G compensating an equal span loss, every stage contributes a fresh ASE increment proportional to 2·n_sp·hν·(G−1)·ΔB — the same expression established in §6. Because each new ASE contribution is subsequently amplified by all downstream stages, and because all prior contributions accumulate in-band, the total ASE power at the link output scales approximately as N × (G−1) × n_sp·hν·ΔB: a linear growth with the number of stages.
The consequence for OSNR is direct: for a chain of N identical amplifiers and spans, OSNR degrades approximately as OSNR_N ≈ OSNR_1 − 10·log₁₀(N) relative to the single-stage value — a 10 dB penalty for every decade increase in stage count.
To make this concrete: if a single amplifier with NF = 5 dB and P_in = 0 dBm yields OSNR_1 = 0 − 5 + 58 = 53 dB (in a 0.1 nm bandwidth), a chain of 10 identical stages yields approximately 43 dB, and 100 stages yields approximately 33 dB — each decade of stages consuming 10 dB of the OSNR budget.
| Number of Stages (N) | 10·log₁₀(N) Penalty (dB) | OSNR_N (dB) | Typical Modulation Margin |
|---|---|---|---|
| 1 | 0.0 | 53.0 | Well above all formats |
| 2 | 3.0 | 50.0 | Well above all formats |
| 5 | 7.0 | 46.0 | Well above all formats |
| 10 | 10.0 | 43.0 | Above all common formats |
| 20 | 13.0 | 40.0 | Comfortable for QPSK / 16-QAM |
| 40 | 16.0 | 37.0 | Adequate for QPSK; review for 16-QAM |
| 80 | 19.0 | 34.0 | Approaching OOK/QPSK minimum margins |
| 100 | 20.0 | 33.0 | Marginal for demanding modulation formats |
Illustrative OSNR vs number of cascaded amplifier stages, computed from OSNR_N = OSNR_1 − 10·log10(N). Parameters: NF = 5 dB, G = 20 dB (compensating 20 dB span loss), P_in = 0 dBm per channel, reference bandwidth 0.1 nm at 1550 nm.
The table illustrates why system reach is OSNR-budget-limited rather than power-limited in most long-haul designs: even with a well-optimised single-stage NF of 5 dB, an 80-span link has consumed 19 dB of OSNR headroom purely through cascade accumulation, leaving only 34 dB — which is adequate for OOK and QPSK but demands careful margin accounting for higher-order formats such as 16-QAM.
Adding spans is therefore not a free variable: each additional amplifier stage is a fixed 10·log₁₀(N/N−1) dB debit against a finite OSNR budget, and the rate of depletion accelerates as N grows larger.
First-Amplifier Dominance and Pre-Amplifier Design
Not all amplifiers in a chain contribute equally to the end-of-link noise floor. The noise contribution of each stage is divided by the cumulative gain of all preceding stages — a principle directly analogous to the Friis cascade formula familiar to RF engineers, where each successive stage's noise temperature is attenuated by the gain product ahead of it.
The physical consequence is stark: the first amplifier's ASE is amplified by every one of the N−1 stages that follow it, arriving at the receiver with the full gain of the remaining chain behind it; the last amplifier's ASE contribution reaches the receiver without any further amplification at all.
The lowest-NF amplifier belongs first in the chain. A 1 dB improvement in the first stage's noise figure translates directly into a 1 dB improvement in end-of-link OSNR; the same 1 dB improvement applied to the last stage in an 80-span link is, for practical purposes, irrelevant to system performance.
The practical design consequence is the pre-amplifier configuration: the first amplifier in a multi-stage or multi-span chain should carry the most stringent NF specification, because it is this stage that sets the noise floor on which every subsequent amplifier builds.
This principle shapes both component selection and system architecture — topics developed fully in the design parameters and mitigation sections that follow — but the underlying constraint originates here, in the physics of cascaded ASE accumulation.
Beat Noise Mechanisms at the Receiver
When ASE co-propagates with the signal to the photodetector, the square-law detection process in the photodiode generates electrical noise through two distinct beat mechanisms, both arising because the detector responds to optical intensity — the square of the total field — rather than to the field amplitude directly.
Signal-ASE beat noise arises from the cross-product between the signal field and the ASE field; its power is proportional to the product of signal power and ASE spectral density, and it is the dominant noise term at the moderate OSNR values characteristic of well-designed links.
ASE-ASE beat noise arises from cross-products between different ASE spectral components beating against one another; its power scales with the square of the ASE power and becomes significant only when OSNR has already degraded to very low values — a regime that represents a link in serious distress.
Both mechanisms produce electrical noise currents at the photodetector output that directly corrupt the bit decision process, making OSNR the primary predictor of bit error rate (BER) — a relationship developed quantitatively in the next section.
The OSNR budget — governed by the three-way trade between per-span launch power, amplifier noise figure, and span length — is the master constraint the designer must satisfy: higher launch power relaxes NF requirements, lower NF relaxes power requirements, and shorter spans reduce the gain each amplifier must supply and therefore the ASE each stage generates. The OSNR degradation quantified here translates directly into elevated BER through the beat noise mechanisms just introduced, which §8 develops into a full system margin analysis.
EDFAs Designed Around Noise Performance
OSNR budgets are only as good as the amplifiers behind them. Explore our custom EDFAs, engineered with noise performance in mind from the ground up.

BER Impact: From OSNR Degradation to Link Failure
OSNR degradation is the intermediate verdict on an EDFA chain — bit error rate (BER) is the final one. Every fraction of a decibel that ASE accumulation strips from the OSNR at the receiver translates, non-linearly and often brutally, into a higher probability that the decision circuit misreads a transmitted bit.
The relationship is steep: as OSNR falls, BER does not degrade gently but accelerates upward rapidly, because the noise is closing the gap between the mean voltage levels representing a "1" and a "0" at the decision point.
The practical engineering bridge between OSNR and BER is the Q-factor, defined as Q = (v₁ − v₀) / (σ₁ + σ₀), where v₁ and v₀ are the mean signal levels for a "1" and a "0" bit, and σ₁ and σ₀ are the noise standard deviations on those levels.
In plain terms, Q is the ratio of the eye opening — the separation between the mean "1" and "0" levels — to the total noise spread at the decision point: a direct, dimensionless measure of how much margin the receiver has to work with.
Two Q-to-BER reference points define the targets that practising optical engineers design against: Q ≈ 6 corresponds to BER ≈ 10⁻⁹, and Q ≈ 7 corresponds to BER ≈ 10⁻¹².
The BER curve is extraordinarily sensitive near these thresholds: the slope is approximately two decades of BER per decibel of Q around BER = 10⁻⁹, meaning a small Q degradation can shift the link from acceptable to failing by several orders of magnitude in error rate.
The physical mechanism connecting OSNR to Q is signal-ASE beat noise: when forward-propagating ASE reaches the photodetector alongside the signal, square-law (intensity) detection generates a cross-term between the signal field and the ASE field whose variance is proportional to signal power multiplied by ASE spectral density.
This beat noise term inflates σ₁ — the noise standard deviation on the "1" level — directly reducing Q and raising BER, and it dominates the receiver noise budget at practical OSNR levels in well-designed amplified systems, with ASE-ASE beat noise remaining secondary until OSNR falls to very low values.
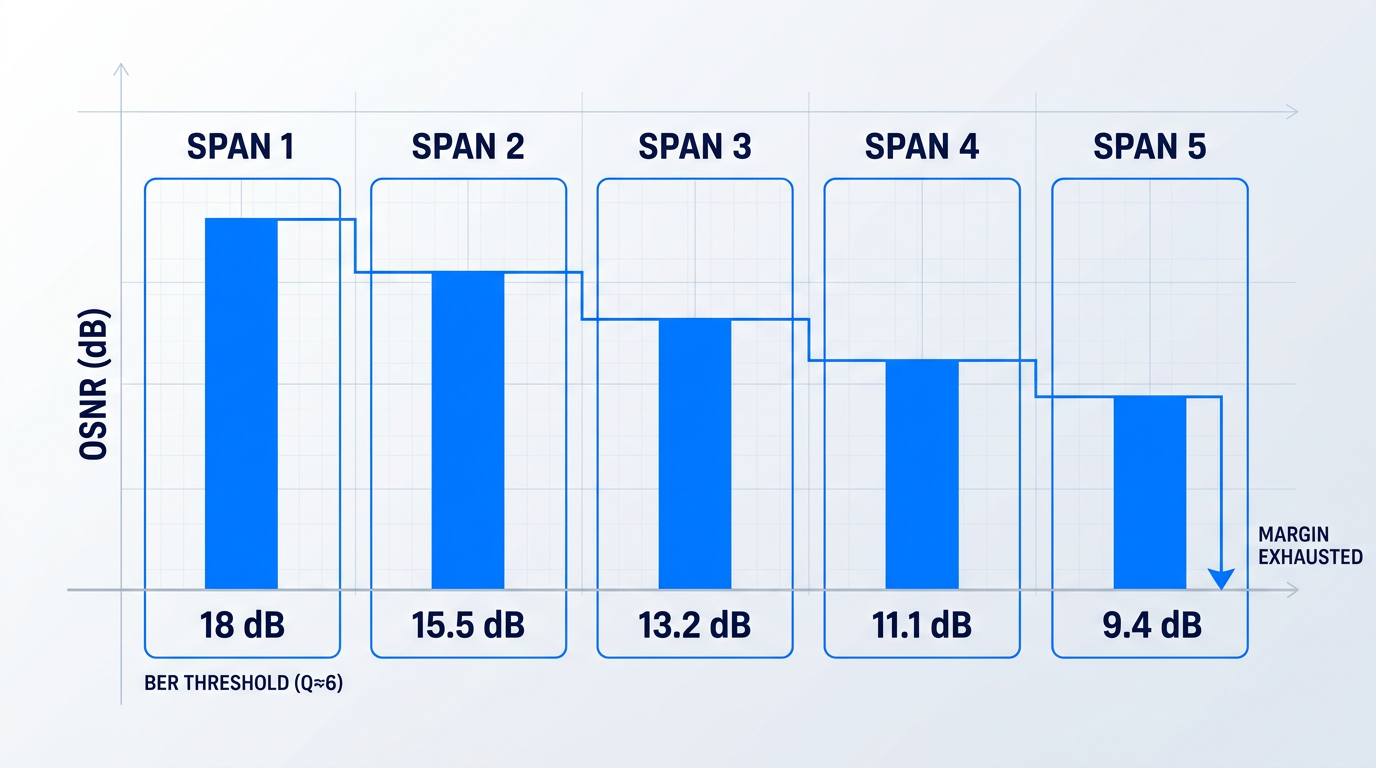
OSNR margin — the difference between the actual OSNR at the receiver and the minimum OSNR required to meet the target BER — is what system designers specify and budget against. A link with zero OSNR margin is already at its BER limit: any additional ASE contribution, from one more span or a degraded amplifier, will push it over.
OSNR margin is therefore not a secondary consideration — it is the reserve that determines how many additional spans can be added, or how much system degradation can be absorbed, before the link fails its BER specification.
That margin is consumed by more than just adding spans: increased fibre loss, amplifier ageing, connector degradation, and component insertion loss all erode it over the operating lifetime of the link, making an adequate initial margin essential for long-term reliability.
The cascade OSNR model established earlier — where total ASE power scales with the number of amplifiers N, driving OSNR progressively lower — means that margin is consumed with every span added, and the rate of consumption is highest in the early spans where each addition represents a large fractional increase in total noise.
As N grows large, each additional span contributes a smaller marginal OSNR penalty, but the cumulative degradation is relentless: the link will eventually exhaust its margin, and for a given target BER, the number of supportable spans is bounded by the initial margin the system was designed with.
The OSNR threshold at which a given BER is achieved is not a fixed number — it depends critically on the modulation format in use.
For 28 Gbaud polarisation-division-multiplexed signals at the 7% hard-decision FEC threshold (BER ≈ 3.8×10⁻³), the required OSNR rises from 10 dB for PDM-BPSK to 12.04 dB for PDM-QPSK, 18.75 dB for PDM-16QAM, and 24 dB for PDM-64QAM — a 14 dB spread across the format hierarchy.
| Modulation Format | Symbol Rate | Required OSNR (HD-FEC threshold) |
|---|---|---|
| PDM-BPSK | 28 Gbaud | 10 dB |
| PDM-QPSK | 28 Gbaud | 12.04 dB |
| PDM-8QAM | 28 Gbaud | 17.14 dB |
| PDM-16QAM | 28 Gbaud | 18.75 dB |
| PDM-32QAM | 28 Gbaud | 22 dB |
| PDM-64QAM | 28 Gbaud | 24 dB |
Required OSNR by modulation format at the 7% HD-FEC BER threshold (BER ≈ 3.8×10⁻³) for 28 Gbaud PDM signals, showing how ASE margin requirements escalate with spectral efficiency.
The pattern is unambiguous: each step up the modulation hierarchy tightens the constellation, reduces the inter-symbol distance, and raises the minimum OSNR the link must sustain to keep BER within specification — compressing the available margin at exactly the point where capacity demands are highest.
As the industry continues to push toward higher-order modulation to extract more capacity from each wavelength, the OSNR margin constraints imposed by ASE become tighter, not looser — making the management of ASE generation and accumulation progressively more consequential for system designers.
With the full consequence chain now established — ASE noise accumulating across amplifier spans, degrading OSNR, reducing Q, elevating BER, and exhausting margin faster at higher modulation orders — the next engineering question is which design parameters within the EDFA itself govern how much ASE is generated in the first place.
EDFA Design Parameters That Govern ASE Behaviour
Understanding what ASE costs the system is only half the engineering problem. The other half is knowing which physical parameters inside the amplifier determine how much ASE is generated in the first place — and crucially, recognising that those parameters are not independent levers you can tune one at a time.
Fibre length, pump power, doping concentration, pump wavelength, and pump direction are all coupled: shifting any one of them moves the optimum of the others. The engineer who understands the physical mechanism behind each parameter can reason through that optimisation — rather than following a rule of thumb that breaks the moment conditions change.
Erbium Fibre Length and the Optimal Length Concept
As signal and pump co-propagate along the erbium fibre, pump photons are absorbed and population inversion builds progressively, producing gain along the fibre's length.
Pump power is finite, however, and beyond a certain point pump depletion sets in: the distal sections of the fibre receive insufficient pump flux to maintain adequate population inversion.
These under-inverted distal sections do not contribute gain — they absorb signal photons and generate additional ASE, converting what should be a gain medium into a net loss and noise source.
The optimal fibre length is the point at which the gain contribution of additional fibre is exactly cancelled by absorption and ASE generation in the depleted region — and this optimum shifts upward as pump power increases, which is precisely why fibre length and pump power must be co-optimised rather than chosen independently.
Pump Power and Population Inversion
Higher pump power drives stronger population inversion throughout the fibre, reducing n_sp and directly lowering the noise figure, while also pushing the pump depletion point further along the fibre and raising the optimal length.
The relationship is not linear: gain and NF improvements follow a saturation asymptote as pump power increases, with each additional increment yielding progressively smaller returns.
For any given fibre length and doping level there is a practical operating range of pump power beyond which further increases deliver negligible improvement — making pump power a parameter with a useful ceiling, not one to simply maximise.
Doping Concentration
A higher Er³⁺ doping concentration delivers more gain per unit length, allowing the same total gain to be achieved in a physically shorter fibre — a direct benefit for compact amplifier designs.
At very high concentrations, ion clustering becomes significant: adjacent excited Er³⁺ ions exchange energy non-radiatively through cooperative upconversion, quenching the excited state before stimulated emission can occur.
This non-radiative energy transfer shortens the fluorescence lifetime and reduces gain per absorbed pump photon, so amplifier efficiency degrades above a concentration threshold — making doping level a compactness-versus-efficiency trade-off, not a parameter to maximise unconditionally.
Pump Wavelength: 980 nm vs 1480 nm
With 980 nm pumping, Er³⁺ ions are promoted from the ground state (⁴I₁₅/₂) to the ⁴I₁₁/₂ level, which decays rapidly and non-radiatively into the metastable ⁴I₁₃/₂ upper lasing level; because stimulated emission from ⁴I₁₁/₂ back to ground state is negligible, ions accumulate in ⁴I₁₃/₂ and near-complete population inversion is achievable.
This near-complete inversion drives n_sp toward its minimum value of 1, allowing well-designed 980 nm-pumped EDFAs to achieve noise figures below 4 dB — approaching the 3 dB quantum limit established in §6.
With 1480 nm pumping, ions are promoted directly into the upper portion of the ⁴I₁₃/₂ level — the same manifold from which stimulated emission occurs — so absorption and emission compete simultaneously, and the achievable inversion fraction is limited by the Boltzmann factor (β ≈ 0.4).
This Boltzmann-limited inversion means n_sp remains above 1, setting a minimum achievable NF of approximately 5.5 dB — a meaningful penalty relative to 980 nm pumping.
| Parameter | 980 nm Pumping | 1480 nm Pumping |
|---|---|---|
| Pump transition | Ground state (4I15/2) to 4I11/2; rapid non-radiative decay populates 4I13/2 | Direct pump to upper 4I13/2 manifold; same level as stimulated emission |
| Achievable inversion | Near-complete; approaches full population inversion | Boltzmann-limited; inversion fraction capped at beta ~0.4 |
| n_sp | Approaches 1 (minimum possible value) | Greater than 1; limited by incomplete inversion |
| Minimum NF | Below 4 dB in well-designed amplifiers | Approximately 5.5 dB floor |
| Quantum efficiency | Lower photon energy ratio; less favourable pump-to-signal conversion | Higher photon energy ratio; more favourable pump-to-signal conversion |
| Preferred application | Pre-amplifiers and noise-sensitive stages where NF is critical | Power amplifiers and booster stages where output power is the priority |
Direct comparison of 980 nm and 1480 nm pump wavelengths across the key parameters governing ASE behaviour and application suitability.
The ~1.5 dB NF penalty of 1480 nm pumping is real, but it is not a disqualifying flaw for power stages — the higher quantum efficiency and greater available pump power make it the more practical choice when output power matters more than minimum noise figure.
Given the first-amplifier dominance principle established in §7, the choice of pump wavelength is most consequential at the pre-amplifier stage: that is where 980 nm pumping's NF advantage has the greatest impact on end-of-chain OSNR.
Pump Direction: Co-propagating vs Counter-propagating
In co-propagating (forward) pumping, the pump and signal enter the fibre at the same end, placing the highest population inversion at the input — exactly where the signal is weakest and where minimising n_sp has the greatest effect on noise figure.
In counter-propagating (backward) pumping, the pump enters from the output end, concentrating the highest inversion where the signal is already strong; this supports higher output saturation power but results in a higher NF because the signal traverses a less-inverted region at the critical input stage.
The application mapping follows directly from the physics: forward pumping for pre-amplifiers where NF is the priority, backward pumping for booster amplifiers where output power dominates, and bidirectional pumping as a practical compromise for in-line amplifiers that must balance both.
Fibre length, pump power, doping concentration, pump wavelength, and pump direction are interdependent — changing any one shifts the optimum of the others, so EDFA design for a given application role is a simultaneous optimisation across all five parameters, never a sequential one.
With the physical mechanism behind each design lever established, the next section turns to the engineering strategies — optical filtering, gain flattening, and amplifier configuration choices — that translate this understanding into practical ASE management.
ASE Mitigation Strategies in EDFA System Design
The physics of ASE accumulation, gain compression, noise figure degradation, and OSNR collapse across amplifier chains are now fully in view — which means the engineering response to all of it is, too.
The mitigation techniques that follow are not corrective measures applied after a system underperforms. They are design decisions, specified during link budget planning, that determine how much ASE the system will accumulate before the first photon is ever transmitted.
Optical Filtering: Rejecting Out-of-Band ASE
ASE's vulnerability to filtering is a direct consequence of its spectral character: it is broad, incoherent, and distributed across the full erbium gain bandwidth spanning roughly 1520–1570 nm, while the signal occupies a comparatively narrow spectral slot.
A narrow optical band-pass filter placed at an amplifier output exploits this asymmetry — it passes the signal band while rejecting the out-of-band ASE power that would otherwise enter the next stage and be further amplified there.
The narrower the filter passband, the greater the out-of-band rejection, but narrower passbands also constrain signal bandwidth — a practical trade-off that engineers resolve against the channel plan and modulation format of the specific system.
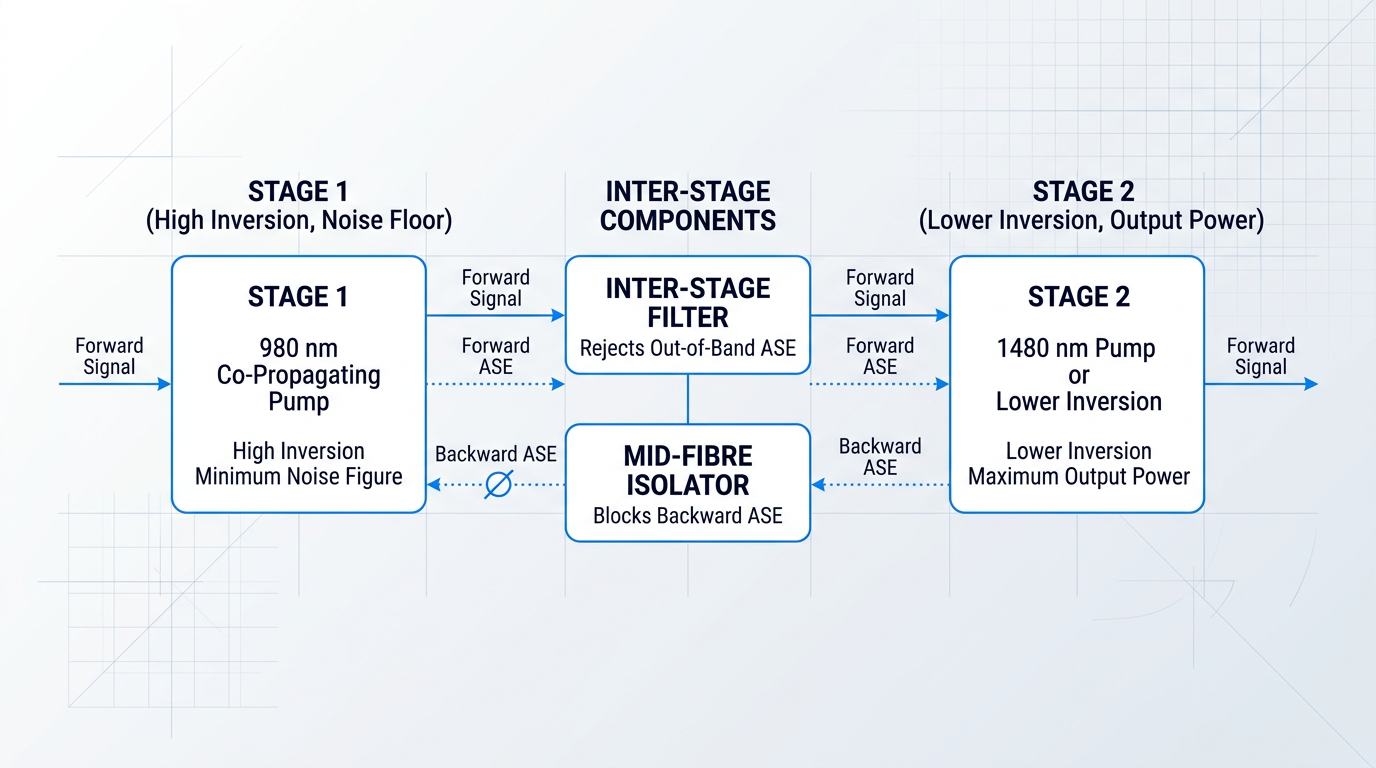
In a multi-stage amplifier, this logic extends to an inter-stage filter placed between Stage 1 and Stage 2: ASE generated in Stage 1 is stripped before it enters Stage 2's gain medium, preventing it from saturating the population inversion that Stage 2 needs to amplify the signal.
Without inter-stage filtering, Stage 2 operates in partial saturation driven by Stage 1's ASE — its effective gain for the signal is reduced, and its own noise figure contribution to the cascade worsens accordingly.
With the filter in place, Stage 2 sees only the signal and residual in-band ASE, allowing it to operate close to its optimal inversion state and contribute far less to the cascaded noise figure than it otherwise would.
Gain Flattening Filters
The erbium gain spectrum is not uniform: at high inversion levels, a pronounced peak near 1530 nm causes disproportionate ASE power to accumulate at that wavelength, concentrating a large fraction of the noise budget into a single spectral region.
A gain flattening filter (GFF) addresses this by attenuating the high-gain wavelengths around 1530 nm while passing the lower-gain wavelengths from roughly 1540–1560 nm, producing a flatter effective gain profile across the C-band.
The result is that ASE power is distributed more evenly across the bandwidth rather than being dominated by the gain peak — a critical outcome in WDM systems, where every channel must maintain a usable OSNR margin simultaneously.
Without gain flattening, channels near 1530 nm are noise-limited while channels at longer wavelengths are under-utilised — an imbalance that compounds across every amplifier in the cascade and ultimately constrains the reach and capacity of the link.
Optical Isolators Within the Gain Fibre
Isolators at amplifier input and output ports are standard practice, but a mid-fibre optical isolator placed within the erbium-doped fibre itself addresses a distinct and often underappreciated problem: backward-propagating ASE.
Without a mid-stage isolator, backward ASE travels back through already-inverted fibre, stimulating additional emission and depleting the population inversion in the upstream section — inversion that would otherwise be available to amplify the forward signal.
Blocking backward ASE with a mid-fibre isolator preserves that inversion, which simultaneously improves the noise figure of the upstream section (because it remains more highly inverted) and increases the gain available to the forward signal.
This is one of the more elegant interventions in EDFA design: a single passive component suppresses a noise source and improves gain through the same physical mechanism.
Amplifier Configuration and Two-Stage Design
Amplifier role selection is itself an ASE mitigation strategy: the three standard configurations — pre-amplifier, in-line, and booster — each carry a different design priority that determines which parameters to optimise.
- Pre-amplifier: Optimised for minimum noise figure. Low input signal power demands maximum inversion: 980 nm co-propagating pump, short high-doped fibre. Sets the noise floor for the entire cascade.
- Booster amplifier: Optimised for maximum output power. High input signal power means the amplifier operates in saturation; pump power is the primary lever for managing ASE-driven gain compression.
- In-line amplifier: Balances gain and noise figure for periodic re-amplification across long-haul spans. Both NF and output power matter; the design trades between them based on span loss and OSNR target.
As established earlier in this guide, the first-amplifier dominance principle means the pre-amplifier's noise figure contribution propagates through every subsequent stage — so minimising it at the pre-amplifier has greater leverage on end-to-end OSNR than any other single configuration decision.
The two-stage EDFA architecture synthesises these priorities into a single unit: Stage 1 is designed exclusively for minimum noise figure, operating at high inversion with a 980 nm co-propagating pump, while Stage 2 is designed for higher output power, operating at lower inversion or with a 1480 nm pump.
Because Stage 1's noise figure dominates the cascade result, the two-stage design achieves both low NF and high output power simultaneously — a combination that a single-stage design cannot deliver without compromising one at the expense of the other.
The inter-stage filter or isolator between the two stages is what makes this possible: it prevents Stage 1's ASE from entering Stage 2 and saturating its gain medium, so each stage can be independently optimised for its specific role.
An inter-stage filter between Stage 1 and Stage 2 of a two-stage EDFA is the single highest-leverage component for improving cascaded noise figure. It prevents Stage 1's ASE from saturating Stage 2, preserving each stage's independent optimisation — and it degrades neither stage's individual performance in doing so.
All of these techniques — optical filtering, gain flattening, mid-fibre isolation, configuration selection, and two-stage architecture — deliver their full benefit only when they are specified together at the link budget stage, before the system is built.
With the complete mitigation toolkit now mapped to its physical foundations, the remaining question is how these principles translate into the broader engineering posture that guides every design decision across the life of an optical link — which is where this guide concludes.
Put ASE Mitigation into Practice
The design principles are clear. Now see how they translate into hardware. Our custom EDFAs are tailored for real system requirements, from noise figure targets to output power and application-specific configurations.

Conclusion
Engineering with ASE in Mind
ASE noise is not a flaw in the amplifier — it is a physical consequence of population inversion, inseparable from the gain itself, and the starting point for every honest system design.
A single amplifier's noise figure only becomes meaningful when you place it inside the full cascade: OSNR margin is a finite resource, and every span draws on it.
The design levers this guide has covered give engineers the means to spend that resource wisely — but only when ASE management is treated as part of the initial specification, not a correction applied after the fact.
Frequently Asked Questions About EDFA ASE Noise
Targeted answers to the questions engineers most commonly ask after studying EDFA ASE noise, noise figure, and amplifier performance in depth.
An erbium-doped fibre amplifier (EDFA) is an all-optical amplifier that amplifies signals in the 1530–1570 nm C-band by exploiting population inversion in erbium ions (Er³⁺) doped into silica glass fibre. It is pumped at 980 nm or 1480 nm and amplifies the optical signal without any electrical conversion. EDFAs are the dominant amplification technology in long-haul and submarine fibre-optic networks precisely because they operate directly in the optical domain across the full C-band.
Typical small-signal gain for a standard single-stage EDFA is 20–30 dB. The actual figure depends on pump power, erbium fibre length, and doping concentration, which must be co-optimised for the target operating point. Critically, any gain comes with ASE noise — the amplifier's noise figure quantifies how much signal-to-noise ratio degradation accompanies that gain, making it the key metric for assessing amplifier quality alongside gain itself.
The quantum-limited minimum noise figure for any phase-insensitive optical amplifier is 3 dB. In practice, well-designed EDFAs pumped at 980 nm achieve 4–5 dB; those pumped at 1480 nm typically achieve 5.5 dB or higher, because 1480 nm pumping cannot achieve complete population inversion. The 3 dB floor exists because even perfect inversion — with a spontaneous emission factor nsp of 1 — still yields a noise figure of 2 (3 dB), a fundamental consequence of phase-insensitive amplification at the quantum level.
Each amplifier in a cascade adds ASE power that co-propagates with the signal. Subsequent amplifiers then amplify both the signal and all accumulated ASE from preceding stages, so total ASE power grows approximately linearly with the number of amplifier stages. Because ASE accumulates while signal power is periodically restored to its launch level, OSNR degrades with each additional span — roughly as 1/N for identical amplifiers and spans. The first amplifier in the chain is the most critical: its noise figure sets the noise floor and has the largest single influence on end-of-link OSNR.
No. ASE is a quantum-mechanical consequence of population inversion — the same physical mechanism that enables optical gain necessarily produces spontaneous emission, and those photons are amplified along with the signal. It cannot be eliminated. It can, however, be managed: narrow optical filtering rejects out-of-band ASE power, optimised inversion levels reduce the spontaneous emission factor, and careful amplifier configuration limits accumulation. The engineering goal is control, not elimination — keeping ASE within the OSNR margin the system's BER specification requires.
Forward ASE propagates in the same direction as the signal (co-propagating) and travels through the system toward the receiver, directly degrading the optical signal-to-noise ratio. Backward ASE propagates in the opposite direction — toward the pump input — and does not reach the receiver directly. However, backward ASE is not benign: it can deplete population inversion in the upstream sections of the erbium fibre, reducing the gain available to the signal and indirectly worsening noise performance. Optical isolators placed within or at the output of the amplifier are used to suppress backward ASE propagation.
Both EDFAs and semiconductor optical amplifiers (SOAs) generate ASE noise as an unavoidable consequence of population inversion. The key distinction lies in the upper-state lifetime of the gain medium: erbium ions in silica glass have an upper-state lifetime of approximately 10 milliseconds, whereas semiconductor gain media have upper-state lifetimes of the order of nanoseconds. This difference has a direct engineering consequence. The long upper-state lifetime of EDFAs means their gain responds very slowly to changes in signal power — saturation is effectively static on the timescale of individual bits or WDM channel power fluctuations. SOAs, by contrast, saturate rapidly, causing cross-gain modulation between WDM channels, a significant impairment in multi-channel systems. This characteristic is a primary reason EDFAs dominate long-haul WDM applications.