

Introduction
Whether you have just encountered the term ASE laser source for the first time or you are already deep into a procurement decision, you are in the right place.
This guide covers the full arc: the physics behind how ASE sources produce their characteristic broadband output, how they sit relative to the alternatives a buyer might consider, the gain media and wavelength options on the market, the specifications that govern selection, how different applications weight those specifications differently, and the advanced challenges that matter when requirements push towards the limits of what a source can deliver.
By the end, you will have enough grounding to read a datasheet critically, ask the right questions of a supplier, and arrive at a selection decision you can defend on technical merit.
TL;DR
Selecting an ASE source is not a checklist exercise. The right choice depends on how bandwidth, output power, spectral flatness, and integration constraints interact for your specific application — and it is the less-discussed challenges, parasitic cavity effects and nonlinear behaviour at higher powers, that most often separate a well-specified source from one that causes problems in deployment.
This article covers:

The physics of ASE broadband output
ASE sources vs. SLEDs, supercontinuum, and lasers
Gain media and wavelength window options
Key specifications and their trade-offs
Application fit: OCT, sensing, and telecom testing
Nonlinear effects, parasitic cavities, and OEM integration
What Is an ASE Laser Source?
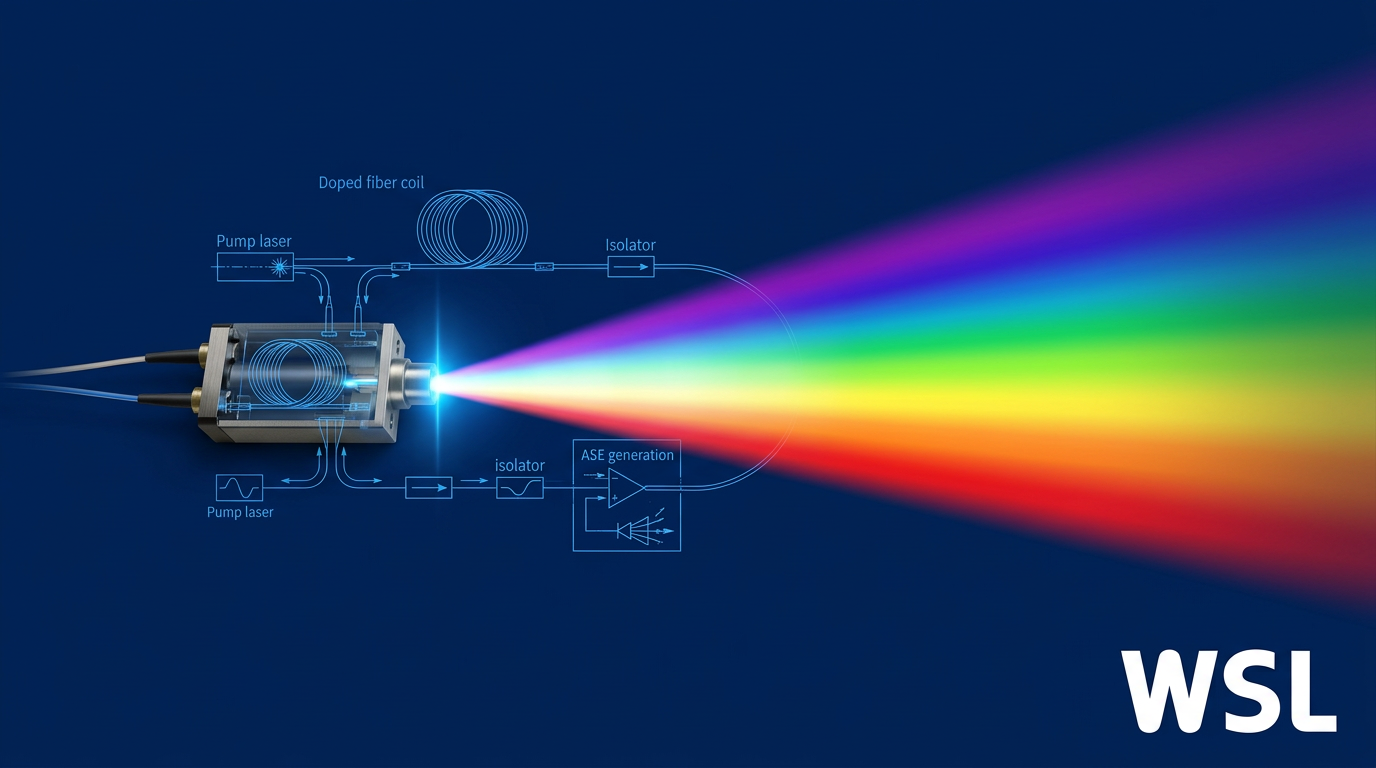
The term ASE laser source contains a deliberate tension: strictly speaking, an ASE source is not a laser at all. Lasers require optical feedback — a cavity that bounces light back and forth to build coherence. An ASE source is specifically engineered to eliminate that feedback.
What the commercial category label actually refers to is a fibre-based broadband light source whose output is driven entirely by amplified spontaneous emission, and understanding that distinction is the foundation for everything else in this guide.
The Physics: Spontaneous Emission, Amplified
When a gain medium is pumped optically, its atoms or ions are excited into upper energy levels — a condition known as population inversion.
Excited ions do not stay in that state indefinitely. They decay spontaneously, releasing photons at random phase and in random directions — this is spontaneous emission, and it is inherently broadband, spanning the full gain bandwidth of the medium.
In a fibre geometry, a fraction of those spontaneously emitted photons couple into the guided mode of the fibre and begin to travel along its length. As they propagate through the inverted population, they trigger further emission by stimulated processes, growing in power with each pass — but carrying no fixed phase relationship with one another.
The result is a directional, high-brightness, broadband output that emerges from the end of the fibre: amplified spontaneous emission, produced without any deliberate resonator.
The Critical Design Choice: Suppressing Optical Feedback
The single most important engineering decision in an ASE source is the deliberate suppression of optical feedback.
If the fibre ends are cleaved flat, Fresnel reflections at each facet create a Fabry–Pérot cavity. Given sufficient gain, the device will begin to lase — producing narrowband, high-coherence output that destroys the broadband character an ASE source is designed to deliver.
Preventing this is not an incidental feature of the design; it is the central engineering challenge. Manufacturers employ several complementary techniques to keep the source firmly in the ASE regime.
- Angle-cleaved fibre ends: Fibre end-faces are cleaved or polished at an angle (typically 8° or more) so that Fresnel reflections are deflected out of the guided mode entirely.
- Optical isolators: In-line isolators block backward-propagating light, preventing any reflected signal from re-entering the gain fibre and seeding oscillation.
- Anti-reflection coatings: AR coatings on optical surfaces within the source further reduce residual reflections that could otherwise accumulate into parasitic feedback.
Together, these measures keep the round-trip gain well below the lasing threshold, preserving the broadband, low-coherence output that defines the ASE source as a product category.
Key Output Properties: What Buyers Need to Know
With the mechanism established, three output properties govern how an ASE source performs in practice — and how it is specified on a datasheet.
Temporal coherence is low in an ASE source. Because the output is built from spontaneously emitted photons with random, uncorrelated phases, the light has no stable phase relationship over time.
Low temporal coherence translates directly into a short coherence length — the path-length difference over which the light can still interfere with itself.
For broad-bandwidth fibre ASE sources, the coherence length is very short — far shorter than for a laser oscillator — which is precisely what makes these sources valuable for OCT and interferometric sensing, where a coherent source would produce unwanted speckle or interference artefacts.
Spectral bandwidth is broad by nature, spanning tens to hundreds of nanometres depending on the gain medium and fibre design — a stark contrast to a laser oscillator, whose linewidth is narrow enough that coherence length extends to metres or beyond.
Because the output power is distributed across this wide spectrum, power spectral density rather than total output power is often the more meaningful metric for system designers; the specifications section of this guide covers that in full.
Spatial coherence, however, remains high. The output is guided by a single-mode fibre, giving it a well-defined, diffraction-limited beam profile that can be focused, collimated, and coupled just as a laser beam can.
| Property | ASE Source | Laser Oscillator |
|---|---|---|
| Temporal coherence | Low — output phase is random and uncorrelated | High — stable phase relationship sustained over time |
| Spectral bandwidth | Broad — spans the gain bandwidth of the medium | Narrow — cavity selection restricts output to a tight linewidth |
| Coherence length | Short — limits interference to very small path differences | Long — light remains self-coherent over large path differences |
| Spatial coherence | High — single-mode fibre output, diffraction-limited beam | High — cavity-defined, diffraction-limited beam |
Side-by-side comparison of ASE source vs. laser oscillator on the four output axes that matter most to buyers evaluating broadband light sources.
The table makes the trade-off immediately legible: ASE sources and laser oscillators share high spatial coherence, but sit at opposite ends of the temporal coherence spectrum.
For applications that need a focusable, fibre-coupled beam without the interference artefacts that high temporal coherence brings, an ASE source occupies a unique and otherwise difficult-to-fill position.
ASE sources are the only common light source category that combines high spatial coherence — enabling laser-like coupling and focusing — with low temporal coherence, eliminating the speckle and interference artefacts that coherent sources produce. Most broadband sources sacrifice one to achieve the other.
As a commercial product category, ASE sources come in two principal implementations. Fibre-based ASE sources use rare-earth-doped optical fibre as the gain medium — different dopants cover different wavelength windows, a landscape explored in full in the gain media section of this guide.
Superluminescent diodes (SLEDs) also operate on the ASE principle but use a semiconductor gain chip rather than doped fibre; they are typically more compact and lower in cost, though generally at lower output power and with narrower wavelength coverage. This guide focuses primarily on fibre-based sources.
With a clear picture of what an ASE source is and what it produces, the natural next question is where it sits relative to the alternatives — SLEDs, thermal emitters, supercontinuum sources, and single-frequency lasers — and that is exactly what the next section addresses.
ASE Sources vs. Alternative Broadband Light Sources
Knowing what an ASE source is only gets you halfway to a purchasing decision — the harder question is whether it is the right tool for your application, or whether a superluminescent diode, a thermal emitter, a supercontinuum source, or a single-frequency laser would serve you better. The answer depends entirely on which properties your application actually needs, because each source type occupies a different position in the power-coherence-bandwidth trade-off space.
The table below maps the five principal source types across the axes a buyer actually uses: output power, spectral bandwidth, coherence length, spatial coherence, RIN character, and typical application fit.
| Source Type | Typical Fibre-Coupled Output Power | Spectral Bandwidth (FWHM) | Coherence Length | Spatial Coherence | RIN Character | Typical Applications |
|---|---|---|---|---|---|---|
| Fibre-based ASE source | >100 mW (e.g. 100 mW PM fibre-coupled at 1040 nm) | ≥50 nm (3 dB); configurable by gain medium | Tens of µm (inversely proportional to bandwidth) | High (single-mode fibre output) | Excess photon noise; lower than supercontinuum; flat white-noise spectrum | OCT, fibre gyroscopes, FBG sensing, telecom component test |
| SLED (superluminescent diode) | 1–100+ mW fibre-coupled; up to ~50 mW SM fibre (commercial single chips) | 20–150+ nm per chip; up to 460 nm FWHM with multi-chip packages | Typically 10–100 µm | High (near-diffraction-limited, M² ≈ 1–1.5) | Excess photon noise; flat white-noise spectrum; RIN inversely proportional to bandwidth | OCT, fibre gyroscopes, low-cost OEM sensing |
| Thermal emitter (globar / tungsten-halogen) | ~9 nW coupled into SMF over 50 nm at 600 nm (3000 K halogen) | UV to far-IR (broadest of any source type) | Very short (µm range); broadband incoherent emission | Very low (large emitting area; isotropic emission) | Incoherent; no excess photon noise but very low usable power | FTIR spectroscopy, mid-IR gas sensing (bulk optics) |
| Supercontinuum source | >2 W total average power via SM fibre | ~400–2400 nm (silica fibre systems) | Very short across full span; coherence varies by spectral slice | High (single-mode fibre output) | Higher pulse-to-pulse intensity noise; nanosecond-pumped systems especially noisy | Ultrahigh-resolution OCT, fluorescence microscopy, hyperspectral imaging |
| Single-frequency laser | Few mW to several W (technology-dependent) | Sub-MHz to sub-kHz linewidth (quasi-monochromatic) | 9.5 km at 10 kHz linewidth (Lorentzian spectrum) | Very high (diffraction-limited) | Approaches shot noise at high frequencies; very low intensity noise | Coherent LIDAR, heterodyne sensing, long-path interferometry, optical comms |
Comparison of five broadband and narrowband light source types across key buyer-relevant specifications to support source selection decisions.
The table reveals a clear pattern: no single source type wins on every axis, and the right choice is determined by which properties are liabilities rather than assets in a given application. Coherence length is the sharpest dividing line — it is an asset for single-frequency lasers and a liability for OCT and interferometric sensing, where it generates speckle and coherent crosstalk.
SLEDs: The Closest Relative to Fibre ASE Sources
SLEDs operate on the same physical principle as fibre-based ASE sources — amplified spontaneous emission without optical feedback — but use a semiconductor gain chip rather than a rare-earth-doped fibre, making them considerably more compact and less expensive.
The coherence character of SLEDs is essentially identical to fibre ASE sources: both offer high spatial coherence (near-diffraction-limited output that couples efficiently into single-mode fibre) combined with low temporal coherence (coherence lengths typically in the 10–100 µm range), making them interchangeable in many OCT and sensing architectures.
Where they diverge is on output power and wavelength flexibility. Commercial single-chip SLEDs reach up to roughly 50 mW fibre-coupled in standard butterfly packages, with multi-chip packages extending bandwidth up to 460 nm FWHM; fibre-based ASE sources can exceed 100 mW from a PM fibre output. For applications where that power headroom matters — pumping a downstream amplifier stage, or working with high-loss sensing setups — fibre ASE sources have a clear advantage.
For cost-sensitive or space-constrained OEM applications, SLEDs are often the better choice: they are smaller, cheaper, and available off the shelf across wavelengths from approximately 770 nm to 1680 nm. Fibre-based ASE sources are the stronger platform when higher output power, broader wavelength options across multiple gain media, or tighter spectral flatness is required.
Thermal Emitters: Broadest Spectrum, Lowest Usable Brightness
Thermal emitters — including the globar and tungsten-halogen lamp — produce the broadest spectra of any source type, spanning from the UV to the far-infrared. The problem is usable brightness: a 3000 K halogen lamp coupled into a single-mode fibre over a 50 nm window around 600 nm delivers approximately 9 nW of optical power, reflecting the fundamental constraint imposed by low spatial coherence.
Thermal emission is isotropic, originating from a large emitting area, and the Van Cittert–Zernike theorem governs how little of it can be collected into a diffraction-limited mode. ASE sources emit into a single spatial mode by design, giving them a brightness advantage of many orders of magnitude in terms of power per unit étendue.
Thermal emitters remain the standard in FTIR spectroscopy and mid-infrared gas sensing where no fibre-coupled alternative covers the required wavelength range and bulk-optic coupling is acceptable. For OCT, fibre sensing, and telecom testing — all of which require single-mode fibre delivery — they are not practical alternatives.
Supercontinuum Sources: Power and Bandwidth at a Price
Supercontinuum sources generate extremely broad spectra by launching high-peak-power pulses into a nonlinear fibre, where self-phase modulation, Raman scattering, and soliton dynamics broaden the spectrum across hundreds of nanometres or more. Silica-fibre systems routinely span approximately 400–2400 nm with total average output powers exceeding 2 W from a single-mode fibre output.
For applications requiring ultrahigh axial resolution — a supercontinuum source with a 246 nm bandwidth at 800 nm has demonstrated approximately 2.7 µm axial resolution in OCT — nothing else comes close on bandwidth. But the trade-offs are significant: the generation process is driven by nonlinear instabilities that are inherently noisy, and nanosecond-pumped systems in particular exhibit elevated pulse-to-pulse intensity fluctuations.
For sensing and OCT applications where RIN is the dominant noise source at high signal levels, fibre ASE sources offer a smoother, more predictable spectrum and a lower noise floor — at the expense of narrower total bandwidth. The decision between ASE and supercontinuum typically comes down to one question: does the application genuinely require the extra bandwidth, or is a lower-noise spectrum the more valuable property?
Single-Frequency Lasers: The Coherence Opposite
Single-frequency lasers sit at the opposite end of the coherence spectrum from ASE sources. Operating on a single longitudinal resonator mode, they produce quasi-monochromatic radiation with linewidths ranging from the megahertz range (DFB laser diodes) down to a few kilohertz or below (fibre DFB lasers, nonplanar ring oscillators). A 10 kHz linewidth corresponds to a coherence length of approximately 9.5 km — compared with the tens-of-microns range characteristic of ASE sources.
This is not a weakness of single-frequency lasers: it is precisely what makes them the right tool for coherent LIDAR, heterodyne detection, long-path interferometry, and coherent optical communications, all of which require a long coherence length to maintain interference contrast over extended path differences.
For OCT, fibre sensing with short gauge lengths, and any application where parasitic reflections or speckle are a concern, however, high temporal coherence becomes actively harmful — producing speckle in imaging, coherent crosstalk between sensing channels, and sensitivity to distant surface reflections. In these contexts, the short coherence length of an ASE source is not a compromise; it is the specification the application requires.
Single-frequency lasers and ASE sources are not in competition. They serve fundamentally different coherence regimes, and the choice between them should be guided entirely by whether the application needs long or short coherence length.
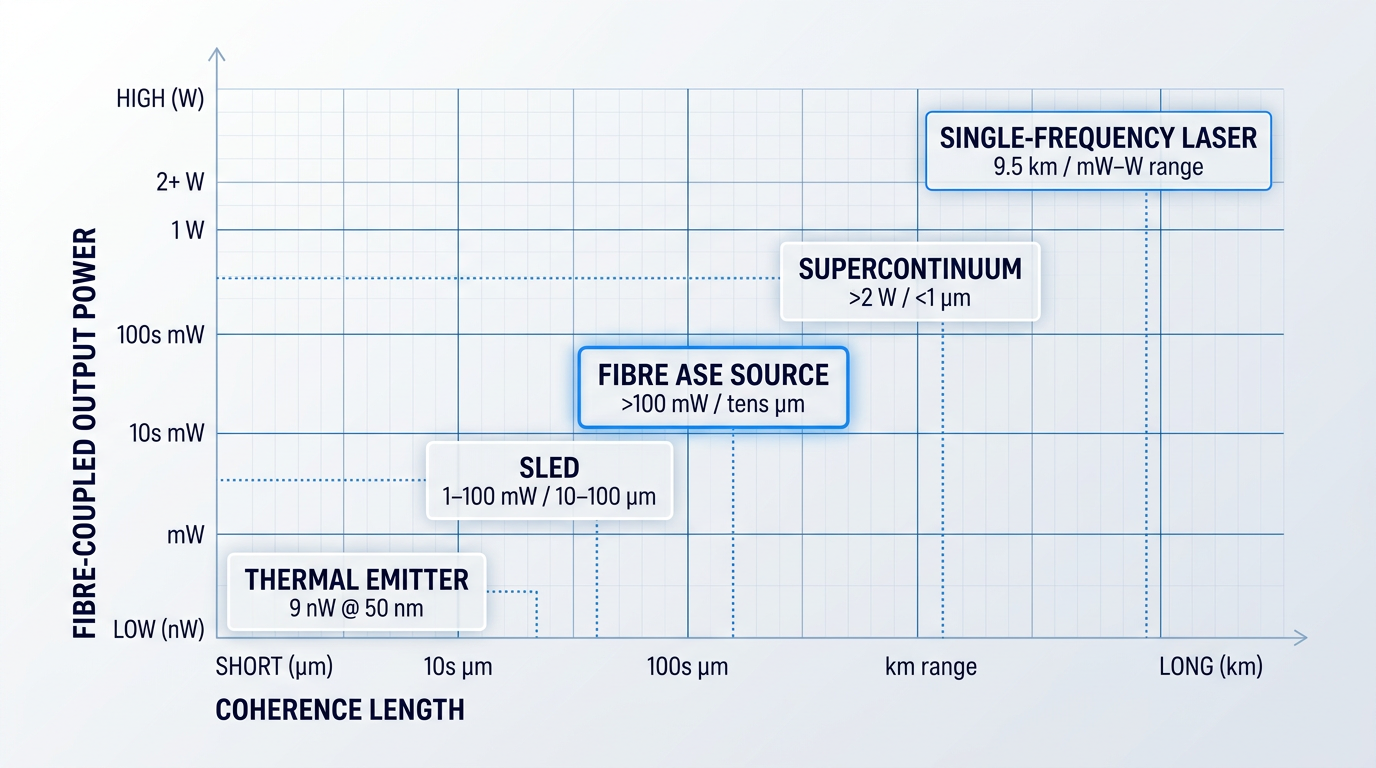
Taken together, the comparison reveals where fibre-based ASE sources sit in the trade-off landscape: high spatial coherence for single-mode fibre compatibility, low temporal coherence for speckle suppression and immunity to parasitic interference, output power substantially above SLEDs, and a smoother lower-noise spectrum than supercontinuum sources — at a cost point that sits between the two. This combination is what makes ASE sources the default choice for interferometric sensing, OCT, fibre gyroscopes, and telecom component characterisation.
No other single source type combines single-mode spatial coherence, micrometre-scale coherence length, output powers above 100 mW, and a flat low-noise spectrum. That unique combination is why fibre-based ASE sources are the reference standard for OCT, fibre gyroscopes, and interferometric sensing — applications that need a laser's focusability without a laser's coherence length.
Having established where fibre ASE sources sit relative to the alternatives, the next practical question for a buyer is which ASE source — and that depends primarily on wavelength coverage, which is determined by the choice of rare-earth gain medium. The next section maps the principal gain media and the wavelength windows they open up.
Gain Media and Wavelength Coverage in ASE Sources
The wavelength an ASE source covers is not a configurable parameter — it is determined by the dopant ion embedded in the gain fibre. Each rare-earth ion has characteristic energy levels that fix the emission window, and the host glass determines whether that emission is usable at all. Choosing a gain medium is therefore the first and most consequential decision in any ASE source selection.
| Dopant Ion | Emission Window | Typical Host Glass | Primary Applications | Key Buyer Constraint |
|---|---|---|---|---|
| Erbium (Er³⁺) | C-band: 1530–1565 nm; L-band: 1565–1625 nm | Silica (standard) | Telecom testing, FBG sensing, FOG, LiDAR, OCT at 1.5 µm | None — mature silica ecosystem, widest component support |
| Ytterbium (Yb³⁺) | 1000–1100 nm (peak ~1060 nm) | Silica (standard) | OCT at 1 µm (choroidal imaging), high-power near-IR sources | Quasi-three-level behaviour below ~1030 nm; optimal design near 1060–1100 nm |
| Thulium (Tm³⁺) | S-band: ~1460–1530 nm; 2 µm: 1700–2100 nm | Silica (shorter λ); fluoride/ZBLAN (S-band, 2 µm) | Gas sensing (H₂O, CO₂, HCl), 2 µm spectroscopy, S-band telecom | Fluoride host required for S-band and 2 µm emission; handling complexity increases |
| Praseodymium (Pr³⁺) | O-band: ~1270–1350 nm | Fluoride glass (ZBLAN) — silica not viable | O-band OCT, next-gen telecom, some sensing | ZBLAN host essential; higher fabrication complexity and limited commercial availability |
Maps the four primary rare-earth dopant ions used in commercial fibre ASE sources across their emission wavelength windows, required host glass, primary application fit, and key practical constraints — giving buyers a direct reference for matching their target wavelength to the correct gain medium.
The table reveals a clear structural pattern: erbium in silica stands apart from every other option in terms of commercial maturity and component availability. The three remaining ions each serve a distinct wavelength niche, but two of the three require fluoride glass hosts — a constraint that carries real procurement and integration consequences.
Erbium: The Commercially Dominant Platform
Erbium-doped silica fibre is the undisputed leader in commercial ASE sources, covering the C-band (1530–1565 nm) and L-band (1565–1625 nm) — the exact spectral region where silica optical fibre has its lowest propagation loss.
The EDFA was first demonstrated in 1987 at the University of Southampton, and erbium-fibre technology has been in continuous commercial development ever since. That decades-long history means buyers have access to a deep ecosystem of compatible components: 980 nm pump diodes, WDM couplers, optical isolators, and standard connectorised fibre — all available off the shelf, from multiple suppliers, at telecom-grade quality.
Operating at 1550 nm also carries a meaningful safety advantage. Light at wavelengths above approximately 1.4 µm is absorbed by the cornea and lens before it can reach the retina, placing erbium-band sources in a substantially less hazardous category than 1 µm ytterbium sources — a practical consideration for lab integration and field deployment alike.
For buyers whose application sits in the C or L band, the commercial ecosystem around erbium is a genuine risk-reducer: splicing to standard SMF-28 fibre, sourcing pump diodes, and finding qualified engineering support are all straightforward in a way that is simply not true for fluoride-fibre alternatives.
Where application-specific erbium-fibre capability is required — spanning C-band, L-band, or dual C+L from a single source, at power levels up to the highest commercially available — the depth of engineering customisation matters as much as the gain medium itself. Woodrow Scientific's custom EDFA platform is one example of what genuinely end-to-end erbium-fibre engineering looks like: designed and built in Southampton (where the EDFA was invented), with every parameter — operating band, output power, pulse regime, cooling, and control firmware — configured per application rather than selected from a fixed catalogue.
That distinction matters because many suppliers in this market are resellers of imported modules rather than manufacturers, which limits their ability to adapt the design, support integration deeply, or push performance to the leading commercially available levels.
Ytterbium: The 1 µm Window for OCT
Ytterbium-doped silica fibre covers the 1000–1100 nm range, with the ~1060 nm region particularly relevant for optical coherence tomography (OCT).
OCT imaging at 1060 nm offers deeper tissue penetration than the more common 800 nm window, enabling visualisation of the choroidal vasculature beneath the retina. Yb-doped fibre ASE sources pumped by diode lasers can produce broadband output centred around 1060 nm with bandwidths exceeding 50 nm — and high-power configurations based on double-clad Yb fibre have demonstrated maximum output powers of 5 W.
Ytterbium also benefits from high conversion efficiency and straightforward fabrication in silica — the same host glass used for erbium — making the handling and splicing processes familiar to any fibre-optics workshop.
Thulium: Gas Sensing and the 2 µm Window
Thulium-doped fibre covers a broad emission range from approximately 1700 to 2100 nm, with the 2 µm region directly relevant to gas absorption spectroscopy — water vapour, CO₂, and HCl all have strong absorption lines in this window.
Host glass choice is a practical constraint here. Silica supports shorter-wavelength thulium emission, but S-band (~1460–1530 nm) and 2 µm emission require a fluoride glass host — typically ZBLAN — because silica's transparency cuts off around 2 µm and its higher phonon energy quenches the relevant metastable levels. Thorlabs' ASE1900, for example, is a Tm-doped fluoride fibre source with a 1870 nm centre wavelength and 100 nm bandwidth, illustrating the kind of turnkey 2 µm ASE product available at the benchtop level.
Praseodymium and the O-Band: The ZBLAN Constraint
Praseodymium (Pr³⁺) is the gain medium for O-band ASE sources, covering approximately 1270–1350 nm — a window relevant for certain OCT configurations and next-generation telecom applications.
The critical constraint is that praseodymium emission cannot be obtained from silica fibre. Silica's high phonon energy causes excited Pr³⁺ ions to decay non-radiatively — the energy dissipates as heat rather than light — before any useful emission occurs. A ZBLAN fluoride glass host is essential: its lower phonon energy suppresses this non-radiative decay and allows efficient O-band emission.
For buyers, this translates directly into procurement complexity. ZBLAN fibre is more difficult and costly to fabricate than silica, more fragile to handle, harder to cleave and splice cleanly, and has limited availability of standard connectorised formats.
Pr³⁺ emission at 1270–1350 nm is physically impossible in silica: the host's phonon energy quenches the transition before any photon is emitted. Every O-band fibre ASE source carries the fabrication and handling constraints of fluoride glass by necessity, making this category structurally more complex than C-band erbium sources.
For ultra-wideband coverage spanning the S, C, and L bands simultaneously, some commercial ASE sources combine Tm-doped fluoride fibre with Er-doped silica fibre in series. The Fiberlabs ASE-FL7701 uses this multi-fibre architecture to achieve spectral power density across 1460–1605 nm, making it suitable for wideband WDM component characterisation where a single gain medium cannot cover the full range.
With the gain-media landscape mapped, the natural next question is how to evaluate performance within whichever window your application requires — which is the focus of the specification discussion that follows.
Key Specifications for Selecting an ASE Source
A datasheet is only useful if you know which numbers to interrogate and, crucially, how those numbers constrain each other. Two ASE sources can share the same headline bandwidth figure yet perform very differently in practice — because bandwidth interacts with flatness, flatness with power spectral density, and power with spectral quality. Understanding those trade-offs before you talk to a supplier is what separates a well-specified source from an expensive mistake.
Wavelength Range and Spectral Bandwidth
The starting point is always centre wavelength and wavelength range: the source must operate within the window your application demands, and at usable power levels across that window.
Here is where datasheets can mislead: bandwidth is not always quoted on the same convention. Some suppliers report it at the −3 dB points (half-power), others at −10 dB or −20 dB — and a source that appears to span 80 nm at −20 dB may deliver usable power across only 35 nm at −3 dB.
This distinction is consequential. If you are specifying a source for FBG interrogation or OCT imaging at a particular tissue depth, you need to know whether the stated range actually covers your working window at the power levels your detector requires — not just at the spectral wings where the source is barely emitting.
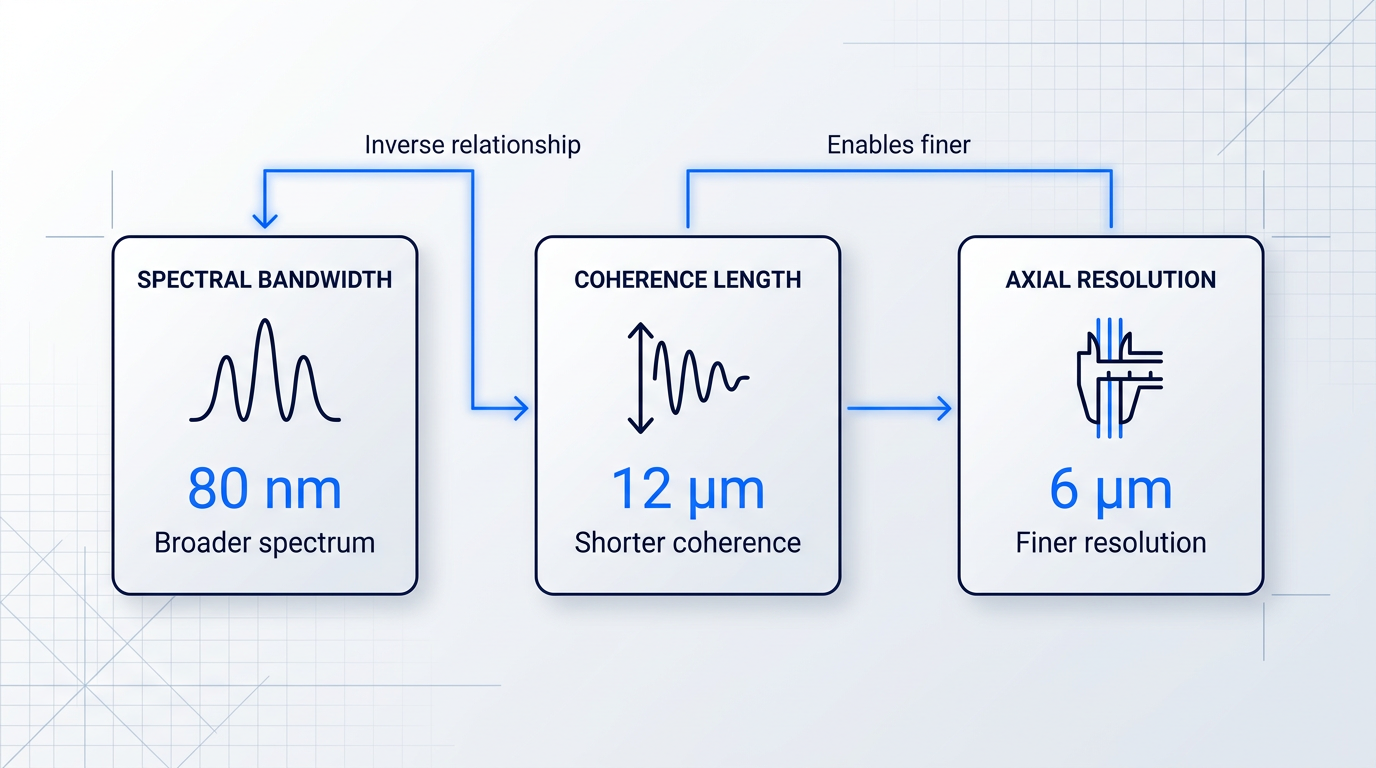
Spectral bandwidth (FWHM) is the specification with the most direct downstream consequences across the entire specification set. Broader bandwidth produces shorter coherence length, which governs axial resolution in OCT and noise suppression in interferometric sensing — so bandwidth is rarely chosen in isolation.
The bandwidth–flatness tension is the trade-off buyers most often encounter unprepared. A very broad ASE spectrum is inherently harder to flatten: spectral ripple tends to increase as bandwidth is pushed wider, and the two goals of maximum bandwidth and maximum flatness pull directly against each other.
Similarly, pushing for higher output power often constrains both bandwidth and flatness — a relationship explored in depth in the later section on power scaling. For now, the practical point is this: every time you ask a supplier to widen the bandwidth, you should simultaneously ask what happens to the flatness specification.
Power Spectral Density
Total output power is the figure most prominently quoted on datasheets, but for the majority of ASE applications it is the power spectral density (PSD) — expressed in mW/nm or dBm/nm — that actually determines detector signal-to-noise performance.
The reason is straightforward: PSD is output power distributed across the bandwidth. A source delivering 50 mW across 10 nm has five times the PSD of one delivering 50 mW across 50 nm, and for a narrowband detector or a sensor interrogating a specific spectral feature, that concentration of power matters far more than the headline wattage.
A moderate-total-power source with a narrow, flat spectrum can therefore outperform a high-total-power source with a broad, uneven one — provided the application's working window falls within the flatter source's range. Always request the PSD figure alongside total power, and ask for it plotted across the working wavelength range rather than as a single peak value.
Spectral Ripple and Flatness
Spectral ripple is the specification most likely to be underweighted by buyers who have not yet encountered its consequences in a real measurement system. It manifests as a periodic modulation of the ASE spectrum — a regular, wavelength-dependent variation in power that sits on top of the broad spectral envelope.
The origin is residual reflections within the fibre assembly: even small back-reflections create weak etalon-like cavities that modulate the spectrum with a ripple whose period is set by the round-trip optical path length of the offending reflection. The mitigation strategies for this belong to a later discussion; what matters here is recognising the consequence.
In OCT, spectral ripple produces secondary coherence sub-peaks — ghost structures or sidelobe artefacts in the point spread function that can obscure or mimic genuine tissue features. In FBG sensing, ripple can mask or mimic genuine wavelength shifts in the reflected Bragg peak. In component test and measurement applications, it directly limits measurement accuracy.
The link back to bandwidth is direct: broader spectra are generally harder to flatten, so a source specified for maximum bandwidth will typically carry higher ripple than a narrower, more carefully conditioned one. Flatness specifications on datasheets are usually quoted in dB peak-to-peak over a stated wavelength window — confirm that the window matches your working range, not just the source's full emission band.
The lower the ripple figure, the cleaner the coherence function — and for interferometric applications, even modest ripple can produce measurement artefacts that are difficult to distinguish from genuine signal features.
Maximising spectral bandwidth and minimising spectral ripple are competing objectives in fibre ASE source design. A buyer who optimises for one without constraining the other will find the supplier has made that trade-off for them — often not in their favour.
The practical implication is that bandwidth and flatness should always be specified together, as a pair, rather than treated as independent requirements on a purchase specification.
Coherence Length
Coherence length is best understood not as a separate specification but as the practical downstream consequence of spectral bandwidth. For a source with a Gaussian spectral profile, coherence length is inversely proportional to bandwidth: double the bandwidth, and you approximately halve the coherence length.
For broadband fibre ASE sources, coherence lengths typically fall in the range of tens of microns — a regime well-suited to applications requiring low-coherence interference, where suppression of unwanted coherence artefacts is as important as the signal itself.
The buyer's mental model should run in reverse: start from the coherence length your application requires, then work back to the bandwidth you need to achieve it. A source specified by bandwidth alone, without reference to the coherence length that results, is a source specified for the wrong quantity.
It is also worth noting that coherence length is sensitive to spectral shape, not just width. A source with significant ripple or an asymmetric spectral profile will have a degraded coherence function — sidelobes rather than a clean central peak — even if the FWHM bandwidth appears adequate on the datasheet.
Polarisation State, RIN, and Output Stability
Most fibre ASE sources produce unpolarised output, characterised by a low degree of polarisation (DOP) — typically well below 5%. This is an advantage for applications sensitive to polarisation-induced measurement errors, including component test, many fibre sensing geometries, and polarisation-diversity receiver characterisation.
Where a defined polarisation axis is required — certain fibre optic gyroscope (FOG) designs and polarimetric sensing configurations, for instance — polarisation-maintaining (PM) fibre-coupled versions are available, and the datasheet should specify both the fibre type and the extinction ratio.
The relative intensity noise (RIN) of a fibre ASE source is inherently flat across frequency, with no relaxation oscillation peaks characteristic of laser oscillators and no longitudinal mode beating characteristic of multimode lasers. This flatness is a practical advantage for sensing and pump applications where intensity noise at specific modulation frequencies would otherwise limit dynamic range.
Broader bandwidth also tends to correlate with lower RIN, because the intensity noise is distributed across a larger number of modes — each contributing independently, with the aggregate fluctuation averaging down. This is one of the few cases where pushing for more bandwidth carries a direct benefit rather than a trade-off.
Finally, output power stability — both short-term (seconds to minutes) and long-term (hours to days) — matters for any calibration-sensitive application where a drifting source means a drifting reference. Temperature control of the pump diode via a thermoelectric cooler (TEC) is the primary engineering lever: sources with integrated TEC control offer substantially better stability than those without.
When reviewing a datasheet, check whether the stability figure is quoted with TEC control active, and over what time window — a stability figure measured over one minute tells you very little about drift over an eight-hour calibration run.
With these specifications understood as an interconnected system rather than a checklist, the practical question becomes how the weighting shifts from one application to the next — which is precisely what the following section addresses.
Still navigating the ASE specification landscape?
Bandwidth, flatness, power, and coherence length all interact in ways datasheets rarely make clear. Speak with a laser expert who can work through your specific requirements with you.

Choosing an ASE Source by Application
Two engineers evaluating the same ASE source datasheet may be looking at entirely different columns. The source that is ideal for telecom component testing — unpolarised, spectrally flat, erbium C-band — may be a poor fit for OCT, not because it is deficient, but because OCT weights the specification set differently: coherence length and spectral shape dominate there, not polarisation state and flatness across a fixed band.
| Application | Coherence Length Priority | Spectral Shape / Ripple Priority | PSD Priority | Wavelength Window | Polarisation Requirement |
|---|---|---|---|---|---|
| Optical Coherence Tomography (OCT) | Critical — short coherence length drives axial resolution; bandwidth must be maximised | Critical — Gaussian-like shape required; ripple produces sidelobe artefacts in the PSF | High — adequate SNR needed at detector | ~800 nm (retinal), ~1060 nm (choroidal), ~1300 nm (deep tissue) | Low DOP acceptable; high spatial coherence required for focusing |
| FBG and Distributed Fibre Sensing | Moderate — low coherence reduces noise but is not the primary driver | High — spectral ripple risks false wavelength-shift readings mimicking strain or temperature | High — superior SNR enables shorter acquisition times | C-band (~1520–1620 nm) for telecom-wavelength FBG arrays | Unpolarised preferred to avoid polarisation-dependent reflectance artefacts |
| Fibre Optic Gyroscopes (FOG) | Critical — short coherence length suppresses Rayleigh backscattering and Kerr-effect bias | Critical — spectral symmetry and mean-wavelength stability govern scale-factor accuracy | Moderate — sufficient for gyroscope signal chain | C+L-band broad coverage improves bias stability | Low DOP preferred; polarisation noise degrades bias performance |
| Telecom Component Testing | Low — coherence length is not a primary driver for IL/PDL/ORL measurement | High — spectral flatness avoids systematic measurement errors across the WDM band | High — adequate PSD needed for OSA dynamic range | C-band (1520–1565 nm) or C+L-band (1520–1620 nm) | Unpolarised (low DOP) — essential to avoid PDL-induced insertion loss bias |
| Spectroscopy and Gas Sensing | Low — coherence length not a selection driver for direct absorption measurements | Moderate — smooth spectrum aids baseline fitting; ripple less critical than in interferometric uses | Moderate — sufficient for absorption measurement; high PSD improves sensitivity | Dominant criterion — must cover target gas absorption lines (e.g., ~2 µm for H₂O/CO₂, C-band for C₂H₂) | Not critical — polarisation state does not affect broadband absorption measurement |
| Full-Field Imaging and Ranging | High temporal — short coherence reduces coherent artefacts; low spatial coherence suppresses speckle | Moderate — smooth spectrum aids spectral compounding for speckle reduction | High per mode — high power per spatial mode enables fast imaging | ~1060 nm (Yb-doped large-core multimode fibre demonstrated) | Low spatial coherence required — single-mode fibre sources are unsuitable |
Comparison of six ASE source application domains against their primary specification drivers, enabling readers to identify priority parameters at a glance for their use case.
The table reveals a clear structural split. Interferometric applications — OCT and FOG — are dominated by coherence length and spectral shape, where even modest spectral ripple translates directly into measurement artefacts or bias errors.
Sensing and testing applications cluster around PSD and flatness, while spectroscopy sits apart from the rest: wavelength window is the first and often decisive criterion, and no other specification can compensate if the source does not cover the target absorption lines.
Optical Coherence Tomography
In optical coherence tomography, axial resolution is inversely proportional to spectral bandwidth — broader bandwidth yields shorter coherence length and therefore finer depth discrimination in the sample.
Wavelength window selection is driven by tissue optics: ~800 nm for retinal imaging (low water absorption in the eye), ~1060 nm for improved choroidal penetration, and ~1300 nm for structural tissue imaging where deeper penetration is the priority.
The bandwidth-versus-spectral-shape trade-off is especially consequential in OCT. A spectrally irregular or rippled source produces ghost peaks in the coherence function — sidelobe artefacts that appear as false structures in the image and degrade diagnostic quality.
A narrower but smooth, Gaussian-like spectrum consistently outperforms a broader but irregular one: the coherence sidelobes of a well-shaped source are suppressed far below those of a rippled source with nominally greater bandwidth.
FBG and Distributed Fibre Sensing
For fibre Bragg grating sensing, the ASE source must provide broad, stable spectral coverage so that multiple FBGs at different Bragg wavelengths can be interrogated simultaneously from a single source.
High PSD is a practical requirement: as the Newport application note on ASE-assisted fibre sensing notes, the high average power of an erbium-doped ASE source delivers superior signal-to-noise compared to alternative broadband sources, enabling shorter acquisition times or longer sensing spans.
Spectral ripple is the critical failure mode in FBG sensing. Because the interrogation system interprets wavelength shifts in the reflected Bragg peak as physical measurands — strain, temperature, or pressure — a source whose spectral shape drifts or ripples can produce false shift readings that mimic a real physical event.
Erbium C-band sources, covering approximately 1520–1620 nm, are the established platform for telecom-wavelength FBG arrays, offering broad coverage, high PSD, and mature wavelength stability.
Fibre Optic Gyroscopes
The fibre optic gyroscope is one of the most demanding ASE source applications. Short coherence length is the primary driver: broadband, low-coherence light suppresses both Rayleigh backscattering noise and the Kerr-effect nonreciprocity that would otherwise introduce a bias error into the rotation measurement.
The SPIE literature on FOG performance identifies excess source noise and mean-wavelength fluctuations as two of the principal error sources limiting gyroscope accuracy, because the FOG scale factor depends directly on the source mean wavelength — drift in mean wavelength translates to a bias error in the rotation output.
Published research has shown that broad, flat C+L-band ASE sources can improve FOG bias stability compared to narrower Gaussian-spectrum sources, with spectral symmetry and mean-wavelength stability mattering as much as raw bandwidth in this application.
Telecom Component Testing
For insertion loss, polarisation-dependent loss, return loss, and WDM filter characterisation, unpolarised output is essential: a polarised source interacting with the PDL of the device under test will conflate source polarisation state with device PDL, introducing a systematic measurement bias.
A Newport application note on passive component testing states that ASE sources, with their inherently very low polarisation, are typically the best choice for broadband component characterisation when properly isolated.
Spectral flatness and output isolation are the primary differentiators between sources in this application — flatness ensures consistent reference power across the measurement band, while isolation prevents reflections from the device under test from disturbing the source.
Erbium C-band and C+L-band ASE sources are the established choice for WDM component characterisation, covering the 1520–1620 nm window where the majority of deployed DWDM infrastructure operates.
Spectroscopy and Gas Sensing
In gas sensing and spectroscopy, the wavelength window is the non-negotiable first criterion — no other specification is worth evaluating if the source does not cover the target absorption lines.
For water vapour and CO₂ sensing in the mid-infrared, thulium-doped fibre ASE sources at approximately 2 µm are the relevant platform, where molecular absorption cross-sections are substantially stronger than at near-infrared overtone wavelengths.
For near-infrared spectroscopy, erbium C-band sources covering 1530–1565 nm are well-matched to the overtone absorption bands of several gas species, including acetylene (C₂H₂), which has approximately 50 strong absorption lines in the 1510–1545 nm region and is widely used as a wavelength reference in this band.
PSD requirements for direct absorption spectroscopy are moderate compared to interferometric applications — sufficient signal-to-noise at the detector is needed, but the extreme PSD demands of OCT or FBG sensing do not apply.
Full-Field Imaging and Ranging
Full-field imaging is the application where the usual preference for high spatial coherence is explicitly reversed. Low spatial coherence is the key property for suppressing speckle — the coherent artefact that corrupts image formation when a spatially coherent source illuminates a rough or scattering surface.
Single-mode fibre ASE sources produce high spatial coherence and are therefore unsuitable; the solution is a large-core multimode fibre ASE source, which distributes emission across many spatial modes and reduces spatial coherence to levels that enable effective speckle suppression.
Researchers at Yale demonstrated a ytterbium-doped extra-large mode area fibre ASE source centred at approximately 1055 nm, delivering 270 mW of continuous-wave emission with 74 nm bandwidth distributed across as many as 70 spatial modes — sufficient to achieve speckle-free full-field imaging when combined with spectral compounding.
Across all six application domains, the wavelength window must be correct before any other specification is evaluated. In spectroscopy it is decisive; in OCT it determines achievable axial resolution; in FBG sensing and telecom testing it defines which physical infrastructure the source can address. A source with outstanding flatness, low ripple, and high PSD in the wrong wavelength band cannot be made to work by improving any other parameter.
With the application-driven specification set defined, the next challenge for high-power deployments is understanding what happens when those requirements are pushed to elevated output power — where physical constraints including stimulated Brillouin scattering and the tension between power and spectral quality begin to limit what is achievable, which is where this guide turns next.
Power Scaling and Nonlinear Effects in ASE Sources
Specifying a high-power ASE source looks straightforward on paper: more pump power drives greater population inversion, which amplifies more spontaneous emission photons, which yields higher output. Up to a point, that logic holds. Beyond it, the physics of the fibre waveguide itself imposes hard constraints that no amount of additional pump power can overcome — and understanding those constraints is what separates a well-specified purchase from an expensive disappointment.
As gain increases in a rare-earth-doped fibre, two distinct categories of problem emerge. The first is nonlinear optical scattering — processes in which the guided light interacts with the fibre material in ways that redirect or degrade the signal. The second is parasitic lasing, covered separately in the following section. Here the focus is on the nonlinear effects: stimulated Brillouin scattering and stimulated Raman scattering, and what they mean practically for buyers specifying high-power ASE sources.
Stimulated Brillouin Scattering (SBS)
SBS arises from the interaction between the guided optical field and acoustic phonons in the silica fibre. The optical field generates a travelling acoustic wave through electrostriction; that wave acts as a periodic refractive index grating which scatters light into a backward-propagating wave red-shifted by the Brillouin frequency (typically around 10–11 GHz in standard silica fibre at 1550 nm). Above the SBS threshold, this backward Stokes wave grows rapidly, effectively capping the forward-propagating power and returning a significant fraction of the pump energy back toward the source.
For a narrow-band or single-frequency CW signal, the SBS threshold in standard single-mode fibre can be as low as a few tens of milliwatts — a genuinely severe constraint at those power levels. Broadband ASE sources benefit from a natural advantage here: because the optical power is distributed across a wide emission spectrum, the power spectral density at any single frequency is far lower than for a spectrally concentrated signal, and the effective SBS threshold rises accordingly.
That advantage is real, but it is not unconditional. At sufficiently high total output powers, even a broad ASE spectrum can accumulate enough PSD in any given spectral slice to approach the SBS threshold for that slice. More critically, if the ASE output is subsequently filtered, spectrally shaped, or injected into a downstream fibre component that narrows the effective bandwidth, the SBS threshold drops sharply and the broad-bandwidth protection disappears. Engineers working with spectrally filtered ASE in long-haul fibre runs should treat SBS as an active design constraint, not a problem that bandwidth alone has solved.
Stimulated Raman Scattering (SRS)
Stimulated Raman scattering operates through a different mechanism. Rather than acoustic phonons, SRS involves optical phonons: the pump field excites molecular vibrational modes in the silica glass, generating a Stokes-shifted component at a frequency approximately 13 THz below the pump in silica fibre — corresponding to a wavelength shift of roughly 80–100 nm in the 1550 nm band. Unlike SBS, this Stokes wave propagates in the forward direction, co-propagating with the signal.
In CW ASE sources, SRS typically manifests as gradual spectral distortion rather than catastrophic failure: power bleeds progressively into longer-wavelength components, degrading spectral flatness and reducing efficiency at the intended operating wavelength. This is distinct from pulsed high-peak-power regimes, where SRS can be far more abrupt and severe — but that scenario is outside the scope of broadband CW ASE operation.
Both the SBS and SRS thresholds share a common scaling relationship with fibre geometry: the threshold power scales with the effective mode field area and inversely with fibre length. Longer gain fibres and smaller core diameters lower both thresholds simultaneously, which is why high-power ASE source designs cannot simply extend the gain fibre to extract more output — doing so makes nonlinear effects progressively worse.
There is a further interaction between gain and spectral quality that is arguably more important for buyers than either SBS or SRS in isolation. As pump power increases and gain rises, the gain spectrum of the doped fibre does not remain constant: the peak of the gain curve is amplified more strongly than the spectral wings, causing the emission bandwidth to contract. This phenomenon — gain narrowing — means that pushing an ASE source toward its maximum rated output does not simply deliver more of the same spectrum. It delivers a narrower one.
An ASE source rated for 80 nm bandwidth at low power may deliver substantially less than 80 nm at its maximum output — because gain narrowing compresses the emission spectrum as inversion increases. Always request spectral data measured at your intended operating power, not at a reference power level.
The practical implication for procurement is direct: a datasheet bandwidth figure is only meaningful at the power level at which it was measured. A supplier who reports bandwidth at a low reference power but sells the source for operation at a much higher output is presenting a specification that does not reflect actual performance in the buyer's system.
The principal engineering response to both SBS and SRS at high powers is to increase the core diameter of the gain fibre, moving to large mode area (LMA) fibre. Because both nonlinear thresholds scale with the effective mode field area, a larger core spreads the optical intensity across a greater cross-section, reducing the nonlinear interaction for a given total power and permitting higher output before spectral degradation becomes significant.
LMA fibre is a genuine solution, but it introduces its own engineering trade-offs that buyers should understand before treating it as a straightforward upgrade.
- Bend loss sensitivity: Larger cores support higher-order modes; tight bending couples power out of the fundamental mode, increasing loss and degrading beam quality.
- Handling complexity: LMA fibre is more demanding to splice and terminate than standard single-mode fibre, requiring tighter process controls and specialist equipment.
- Package constraints: Minimum bend radius requirements for LMA fibre limit how compactly the gain stage can be coiled, affecting overall source form factor.
These are manageable trade-offs in a well-engineered design, not disqualifying flaws. The point is that moving to LMA fibre is a system-level decision that touches mechanical packaging, splicing process, and thermal management — not just a fibre substitution.
When evaluating suppliers of high-power ASE sources, the depth of their engagement with these effects is itself a quality signal. A supplier who can quantify the SBS and SRS margins for a proposed design, articulate how their architecture mitigates nonlinear effects — whether through LMA fibre, careful fibre length management, or spectral engineering — and provide spectral data at actual operating power is demonstrating the engineering rigour the application demands. A supplier who cannot discuss these constraints, or who dismisses them as irrelevant, is either operating well below the power levels where they matter (worth verifying) or has not fully characterised the limits of their own product.
Nonlinear effects set the ceiling on what high-power ASE sources can deliver — but spectral quality can be compromised at any power level by a subtler and distinct problem: parasitic reflections within the fibre assembly that create unintended resonant cavities.
Parasitic Cavity Effects and Spectral Stability
Every commercial ASE source datasheet lists a spectral ripple figure — typically expressed in dB — yet almost none explain where it comes from. For a source explicitly designed to suppress optical feedback, the existence of periodic spectral modulation can seem paradoxical. The answer lies not in the gain medium, but in the fibre assembly surrounding it.
Residual Fresnel reflections at fibre end faces, connectors, and splices create weak round-trip optical paths within the assembly. Each such path acts as a low-finesse Fabry–Pérot etalon: it modulates the ASE output spectrum with a periodic ripple whose period is governed by the optical path length of the parasitic cavity. Shorter cavities produce broader ripple periods; longer cavities produce finer, more closely spaced fringes.
The consequences are application-specific and scale with interferometric sensitivity. In OCT, spectral ripple generates secondary coherence sub-peaks — sometimes called ghost peaks or sidelobes — in the point spread function, manifesting as ghost images or degraded axial resolution. In FBG sensing, ripple can mask or mimic small wavelength shifts, introducing measurement error. In telecom component testing, it places a floor on achievable insertion-loss and PDL measurement accuracy.
Ripple also defines a threshold beyond which a far more serious failure occurs. If the round-trip gain at any wavelength exceeds the round-trip loss, the source crosses the lasing threshold at that wavelength and converts from a broadband ASE source into a narrowband oscillator. This parasitic lasing is not a degraded mode of operation — it is a categorical failure: the device is no longer an ASE source at all.
A well-engineered ASE source suppresses parasitic feedback through a combination of complementary measures, not a single fix.
- Angle-cleaved fibre ends: Fibre ends cleaved at a sufficient angle deflect Fresnel back-reflections out of the guided mode, preventing them from re-entering the gain region.
- Faraday isolators: Optical isolators block backward-propagating light regardless of its origin, providing robust suppression independent of connector or splice condition.
- FC/APC connectors: Angled physical contact connectors offer substantially higher return loss than standard FC/PC connectors — a meaningful difference at the output port for interferometric applications.
- Splice and connector cleanliness: Contaminated or poorly made splices are among the most common sources of unexpected reflections in deployed systems; cleanliness is an ongoing discipline.
These measures are complementary layers of suppression: a well-designed source typically deploys all of them together rather than relying on any single approach. The integrated effectiveness of the entire assembly is captured in the output isolation specification — the figure on a datasheet that quantifies how well the source suppresses parasitic feedback at its output port.
For precision interferometric applications — fibre gyroscopes, OCT systems, coherence-domain sensing — the output isolation figure deserves explicit scrutiny. Two sources can both be sold as broadband ASE laser sources while differing by tens of dB in isolation; for applications sensitive to spectral purity, that difference is not marginal.
When evaluating suppliers, the most telling quality signal is not the isolation figure itself but how the source's spectral character is characterised. A supplier who reports only averaged spectral ripple from a spectrum analyser trace is describing how the spectrum looks; a supplier who measures secondary coherence sub-peaks via Michelson interferometer is describing how the source will actually behave in an interferometric instrument.
The ratio of the primary coherence peak to the strongest secondary peak — measurable only with an interferometer, not a spectrum analyser — is the specification that directly predicts ghost-image severity in OCT and measurement floor in coherence-domain sensing. Suppliers who publish this figure understand their source's interferometric performance; those who do not may not have measured it.
With the spectral quality considerations understood, the practical question becomes how these choices — connector type, fibre-end treatment, and isolation specification — fit into the broader picture of integrating an ASE source into an instrument, which is the focus of the next section.
Integrating an ASE Source: Engineering Decisions That Matter
Selecting an ASE source is only half the work. The integration decisions that follow — fibre type, connector, form factor, power supply, thermal management, and control interface — are where deployment projects succeed cleanly or accumulate expensive workarounds.
Each of these decisions interacts with the others, and each carries a real cost if deferred to late in the programme. The five areas below are the ones that most reliably bite engineers who treat them as formalities.
- Fibre delivery configuration: Choose SM fibre for most sensing and OCT applications; specify PM fibre where polarisation alignment is critical downstream. Always specify FC/APC connectors for superior return loss — back-reflections drive the parasitic cavity effects covered in the preceding section.
- Form factor and packaging: Benchtop, OEM module, and compact formats each impose different size, weight, and connector-placement constraints. Verify that the module's thermal footprint fits the host system's available space and cooling architecture before committing to a mechanical design.
- Power supply requirements: Most OEM ASE modules run from 5 V or 12 V DC rails. Power supply ripple and noise matter: pump diode drive-current noise transfers directly to output power fluctuations, degrading stability in ways the module datasheet may not make obvious.
- Thermal management: Verify operating temperature range, maximum heat dissipation, and whether TEC control is internal or requires external drive. Pump diode temperature drift shifts both centre wavelength and output power — critical in calibration-sensitive deployments.
- Control interface: Common options include RS-232, USB, GPIB, and TTL-level trigger inputs. Confirm interface compatibility with the system controller early — retrofitting a mismatch is costly. Some modules support modulation at rates up to tens of kHz for lock-in or time-gated applications.
These decisions are not independent. The module's thermal footprint constrains which form factors are viable; power supply ripple sets a floor on achievable output stability regardless of the source's own noise specification; and the connector choice — specifically, the return loss performance of FC/APC versus FC/PC — directly determines how much residual parasitic feedback the source must tolerate from the downstream optical assembly.
There is also a sourcing dimension that shapes all of these decisions. A significant portion of suppliers in the ASE and EDFA market are resellers or importers of catalogue modules rather than manufacturers — which means limited capacity for deep integration support, slower response when issues arise, and no ability to modify the design to fit the application.
For demanding integration scenarios, working directly with the source manufacturer — configuring delivery fibre, control firmware, form factor, and thermal management as part of a single engineering conversation — is what separates a clean deployment from one that accumulates workarounds at every stage.
Configuring fibre termination, firmware, form factor, and thermal management through a direct engineering relationship with the manufacturer — rather than adapting a fixed catalogue module — removes the most common sources of integration risk before they become programme delays.
Woodrow Scientific Limited's Custom EDFA is the concrete example of this model for erbium C- and L-band applications. Designed and built in Southampton, UK — at the Optoelectronics Research Centre where the EDFA was invented — every unit is engineered end-to-end to the application, with operating band, output power, pulse regime, cooling, delivery cable, form factor, and control firmware all configured per project, on patented in-house technology backed by over 200 years of combined engineering experience.
At the performance level, WSL pushes erbium-fibre output to the leading commercially available figures: average powers above 100 W, pulse energies above 10 mJ, and peak powers above 100 kW — with both C-band and L-band delivered through a single cable, eliminating the need for a second amplifier in dual-band configurations.
The complete benefit set includes air- or water-cooled options (directly relevant to the thermal management decisions above), CE and UKCA certification, eye-safe 1550 nm operation with reduced-hazard-zone builds available, and direct engineering support throughout integration — not a reseller chain, but the engineers who built the amplifier.
With the integration decisions mapped, the remaining question is how to sequence the overall source-selection process and where to go from here — which is what the concluding section addresses.
Ready to discuss your ASE source deployment?
Integration decisions are where projects succeed or stall. Speak with a laser expert about your specific configuration, wavelength requirements, and OEM constraints before committing to a solution.

Conclusion
Sequence first, then supplier quality
Getting the selection sequence right matters more than any single specification: wavelength window is fixed by your application, bandwidth and coherence length follow from that, and power and spectral quality are optimised last — not first.
The advanced questions this guide covered — nonlinear effects, parasitic feedback, the honest bandwidth-versus-power trade-off — are worth putting to any prospective supplier, because a manufacturer who answers them with precision is showing you something a datasheet cannot.
You now have the vocabulary to read a specification sheet critically; for anything beyond a standard catalogue fit, a specialist manufacturer is the right next conversation.
Frequently asked questions about ASE light sources
Practical answers to buyer questions, terminology clarifications, and related topics for engineers and technical buyers evaluating ASE broadband light sources.
Both operate on the principle of amplified spontaneous emission, but SLEDs are semiconductor devices whereas fibre-based ASE sources use rare-earth-doped optical fibre as the gain medium. Both suppress cavity feedback to produce broadband, low-coherence output — the difference lies in the practical consequences of the gain medium choice. SLEDs are compact, lower-cost, and typically limited to fibre-coupled output powers of up to around 100 mW. Fibre-based ASE sources offer higher output power, access to multiple rare-earth gain windows not available in semiconductor materials, and — in many configurations — better relative intensity noise (RIN) performance. The practical decision rule: choose a SLED for compact, cost-sensitive, lower-power applications; choose a fibre ASE source when you need higher power, demanding RIN performance, or a wavelength window that semiconductor gain media cannot reach.
Coherence length is inversely proportional to spectral bandwidth for a Gaussian spectrum — the broader the bandwidth, the shorter the coherence length. As a concrete illustration: a source with approximately 40 nm bandwidth at 1550 nm yields a coherence length in the range of roughly 30–60 µm; a source with approximately 100 nm bandwidth yields a correspondingly shorter coherence length. The exact value depends on spectral shape as well as bandwidth. A Gaussian spectrum gives the shortest coherence length for a given FWHM, while a flat-top spectrum with the same FWHM produces a longer coherence length with more pronounced sidelobes in the coherence function. This matters practically because coherence length sets the axial resolution in OCT and governs noise suppression in interferometric sensing — so matching spectral shape and bandwidth to your application's resolution requirement is as important as the headline bandwidth figure.
Spectral ripple arises from residual reflections within the fibre assembly — at connector end-faces, splices, or internal components — that form weak Fabry–Pérot etalon cavities. These cavities modulate the ASE spectrum with a periodic ripple whose period is set by the round-trip optical path length of the reflection. How much is acceptable depends entirely on the application. Interferometric and OCT applications are the most demanding: ripple produces secondary coherence sub-peaks (ghost images or sidelobes in the point spread function) that degrade image quality and sensing accuracy. For these applications, look for suppliers who specify secondary coherence sub-peak levels measured by Michelson interferometer, not just an averaged spectral ripple figure in dB. Component testing applications — insertion loss, PDL, WDM filter characterisation — can generally tolerate more ripple. Mitigation approaches include angle-cleaved fibre ends, FC/APC connectors, and Faraday isolators within the source assembly.
For many sensing and OCT applications, yes — and a fibre ASE source is often the better choice. Fibre ASE sources typically offer lower relative intensity noise (RIN) and smoother, more spectrally uniform output than supercontinuum sources, which matters significantly for interferometric applications where noise directly limits measurement accuracy. Supercontinuum sources, however, offer broader total bandwidth — often spanning hundreds of nanometres across the visible and near-infrared — and higher total output power, capabilities that ASE sources cannot match. The practical guidance: if the application genuinely requires the bandwidth of a supercontinuum source, there is no substitute. If it requires moderate bandwidth with low noise and a smooth spectrum, a fibre ASE source is likely the more appropriate and cost-effective choice. The trade-off is clear: bandwidth and total power favour supercontinuum; RIN and spectral smoothness favour ASE.
Commercial benchtop C-band erbium fibre ASE sources typically span approximately 13 dBm (around 20 mW) to approximately 23 dBm (around 200 mW) in standard catalogue products. Power levels vary by gain medium and wavelength window — erbium C-band is the most mature and commercially available platform with the widest range of catalogue options; ytterbium (~1060 nm) and thulium (~2 µm) gain windows carry different typical power ranges. For demanding applications, custom high-power erbium-fibre configurations can reach substantially higher average powers — purpose-built platforms such as configurable high-power EDFAs can deliver average powers well above 100 W, though these are distinct from standard benchtop ASE sources. For most applications, the more meaningful metric is power spectral density (PSD) — total output power distributed across the bandwidth — rather than raw total power, since it is PSD that determines the usable signal level within any given spectral band.
High-gain fibre ASE sources are meaningfully sensitive to back-reflections. Because the gain medium operates at high gain without a stabilising cavity, even modest back-reflections can re-enter the gain fibre and cause parasitic lasing at the wavelength where round-trip gain exceeds round-trip loss — transitioning the source from broadband ASE to narrowband lasing and destroying its utility for low-coherence applications. At lower feedback levels, output power instability and fluctuation are the more common consequence. Practical operating discipline: always use FC/APC connectors (not FC/PC) on the output and all connected components, since the angled end-face deflects Fresnel reflections out of the guided mode. Verify the output isolation figure on the source datasheet — commercial sources typically specify 30–55 dB of output isolation. Avoid connecting components with poor return loss without an in-line optical isolator between them and the source output.
Five main categories cover the broadband source landscape in photonics. Thermal emitters (globar, tungsten-halogen lamps) offer very broad spectral coverage but extremely low spatial coherence and low usable brightness. LEDs are broadband and low-cost but limited in power and spatial coherence. Superluminescent diodes (SLEDs) are semiconductor-based ASE sources — compact and moderate-power, with bandwidths typically ranging from around 20 nm to over 150 nm. Fibre ASE sources use rare-earth-doped fibre as the gain medium, offering higher output power, high spatial coherence, low temporal coherence, and wavelength coverage across multiple gain windows. Supercontinuum sources provide very broad bandwidth and high power but at higher noise levels and higher cost. Each type occupies a distinct position in the power–coherence–bandwidth–cost trade-off space, and the right choice depends on what the application actually requires rather than which source type offers the most impressive headline specification.